Een geanimeerd cartogram maken (QGIS3)
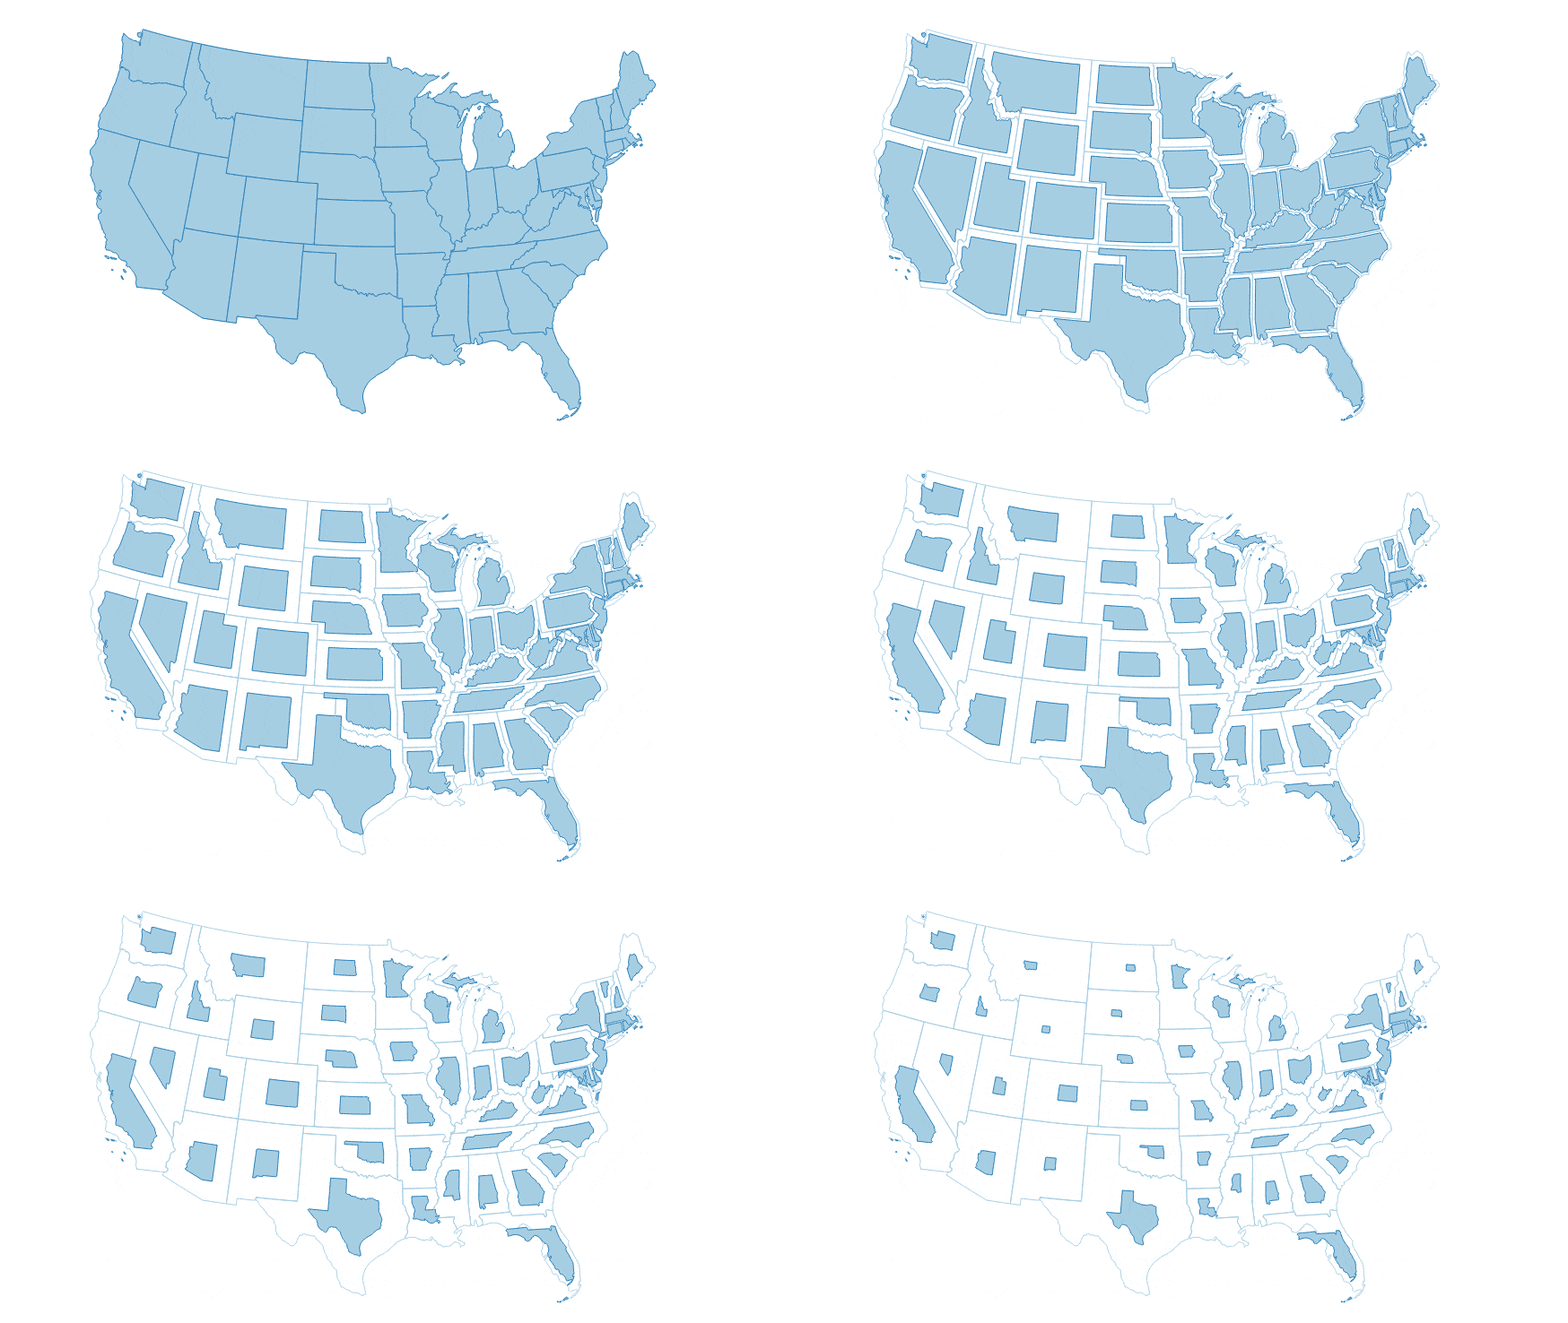
Een cartogram is een type kaartvisualisatie waarin de vorm van elk object in verhouding is vervormd tot een variabele. Cartogrammen maken het gemakkelijk grote variaties in de gegevens te zien. De eenvoudigste methode om een cartogram te maken is door de grootte van elke regio op schaal te brengen, overeenkomstig een variabele. Deze methode behoudt de originele vorm van de polygoon en wijzigt alleen de grootte. Deze staan bekend als Niet-aaneensluitende isomorfische cartogrammen. In deze handleiding zullen we leren hoe expressies van QGIS te gebruiken om een cartogram te maken en Tijdbeheer te gebruiken om een animatie te maken die de objecten gradueel vervormt tot de doelgrootte.
Deze handleiding is geïnspireerd op Hans van der Kwast’s excellente handleiding voor een cartogram. De formule voor de hier gebruikte schaalfactor is afkomstig uit het originele paper Noncontiguous Area Cartograms door Judy M Olson.
U kunt ook mijn video op YouTube bekijken QGIS Expressions: Hidden Gems and Unexpected Possibilities die de concepten achter deze handleiding uitlegt.
Overzicht van de taak
We zullen een laag van de staten in de Verenigde Staten nemen en een geanimeerd cartogram maken door elke staat op grootte te brengen naar inwoners. De resulterende kaart zal het gebied van elke staat op grootte hebben gebracht, proportioneel ten opzichte van het aantal inwoners.
De gegevens ophalen
United States Census Bureau verschaft cartografische bestanden met grenzen, naast demografische gegevenssets. We zullen de gegevens downloaden en ze verwerken om een gegevenslaag te maken die geschikt is voor onze taak.
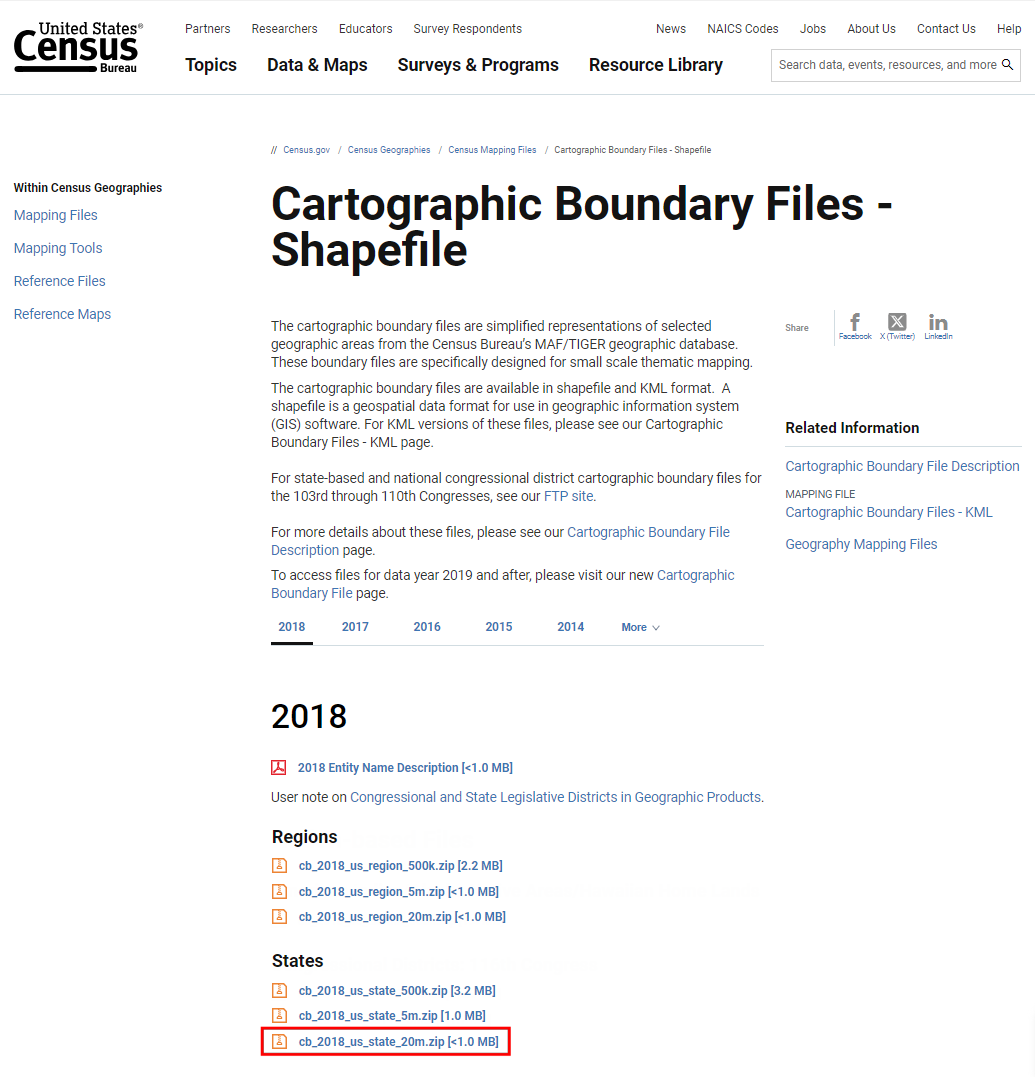
Bezoek de pagina met gegevens Cartographic Boundary Files - Shapefile. Download het bestand
cb_2018_us_state_20m.zip. Dat heeft de polygonen die we nodig hebben voor de visualisatie.
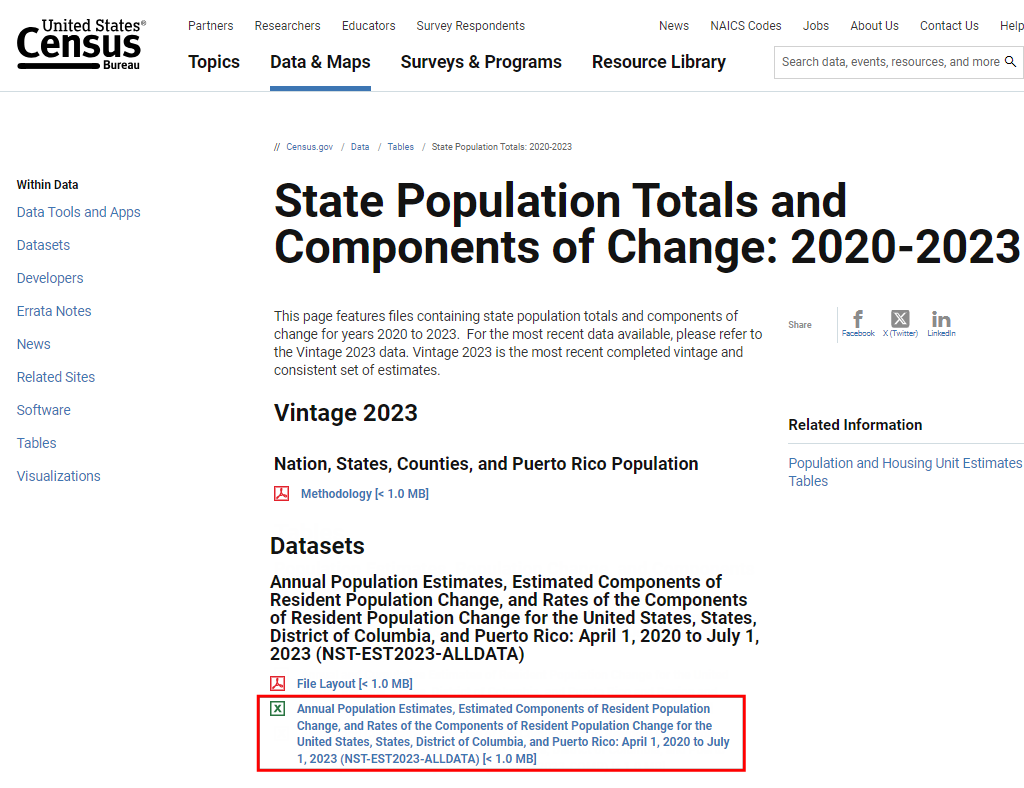
De polygonen van de staten hebben geen demografische gegevens. Deze gegevens moeten afzonderlijk worden gedownload en afzonderlijk worden samengevoegd met de Shapefile om in een GIS te kunnen gebruiken. Bezoek de pagina State Population Totals and Components of Change: 2020-2023 en download de gegevensset Annual Population Estimates, Estimated Components of Resident Population Change, and Rates of the Components of Resident Population Change for the United States, States, District of Columbia, and Puerto Rico: April 1, 2020 to July 1, 2023 , die zal worden gedownload als
NST-EST2023-ALLDATA.csv.
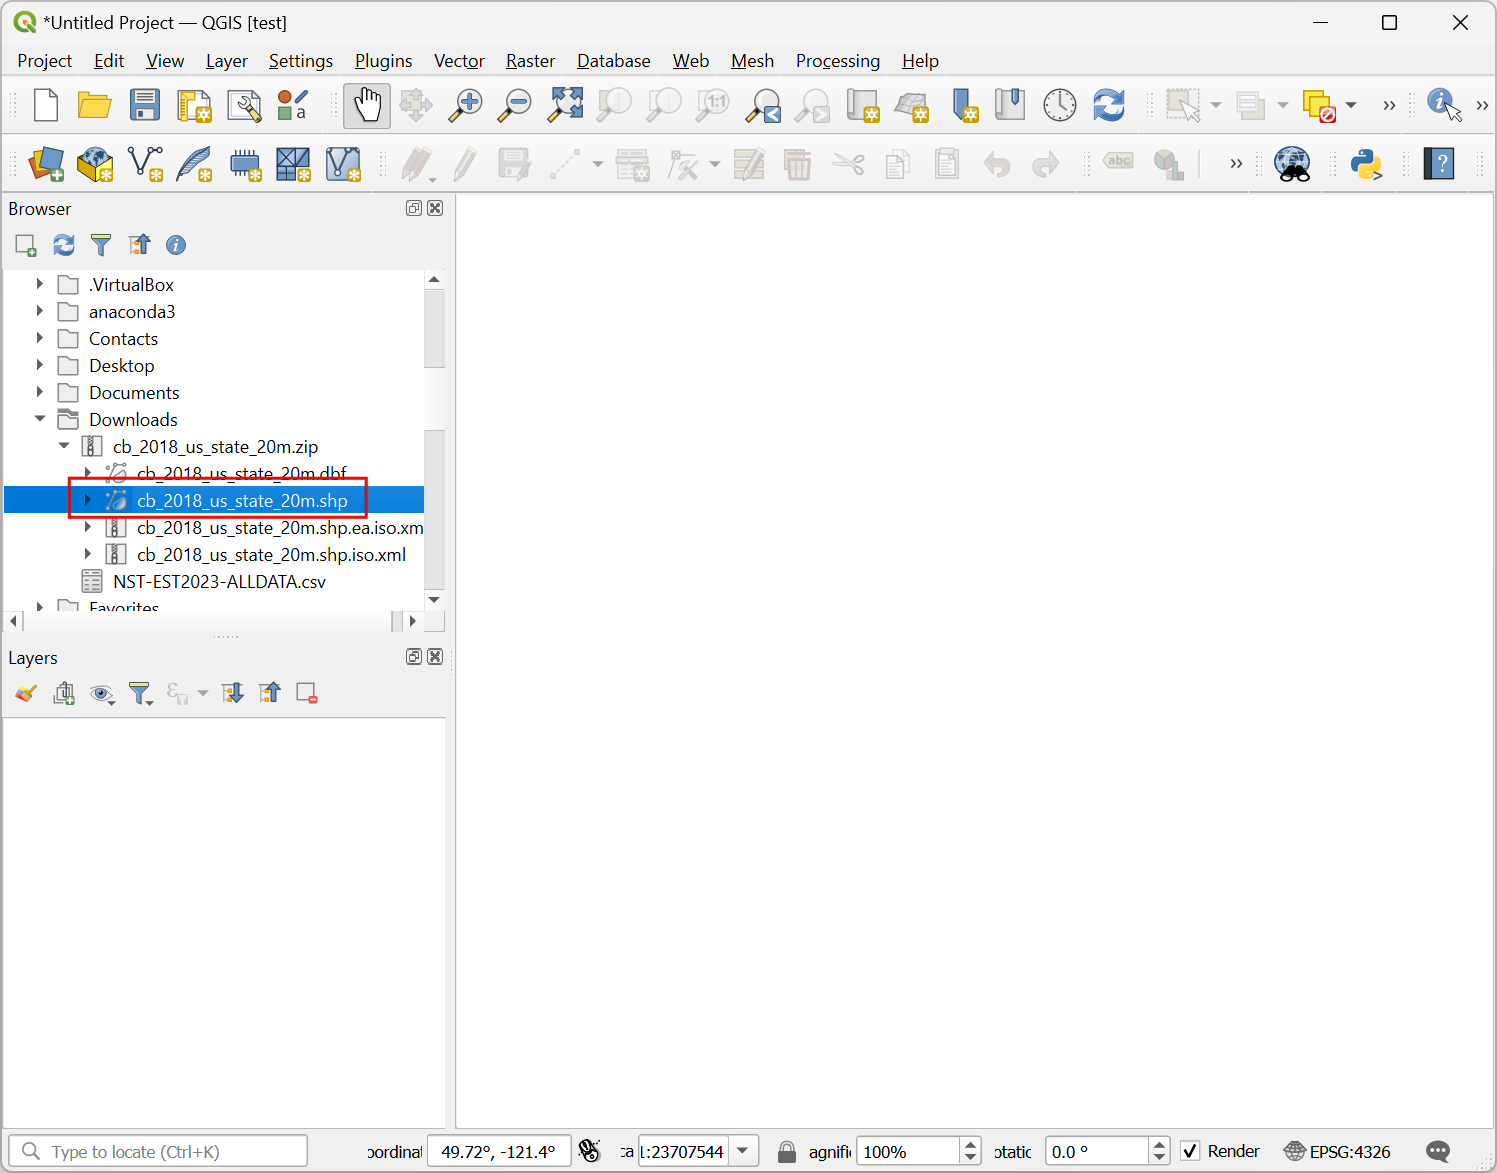
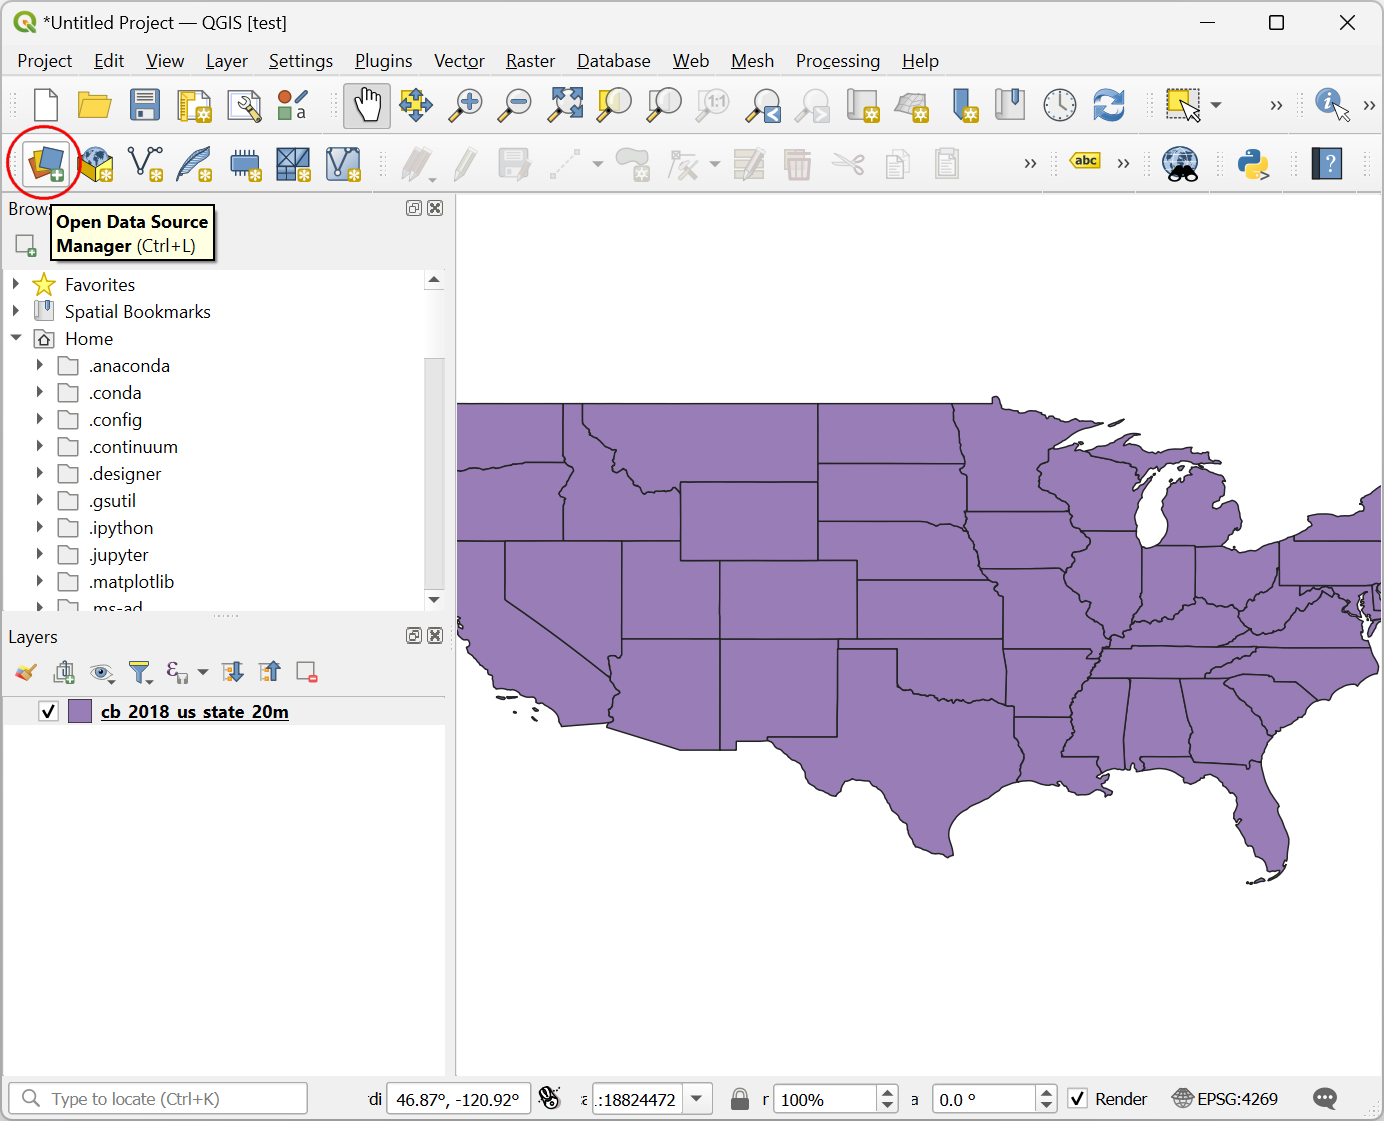
Open QGIS. Zoek naar het bestand
cb_2018_us_state_20m.zipin de QGIS Browser en vergroot het. Sleep het bestandcb_2018_us_state_20m.shpnaar het kaartvenster en zet het daar neer.
Een nieuwe laag
cb_2018_us_state_20mzal worden toegevoegd aan het paneel Lagen. Vervolgens zullen we het CSV-bestand laden. Klik op de knop Databronnen beheren openen.
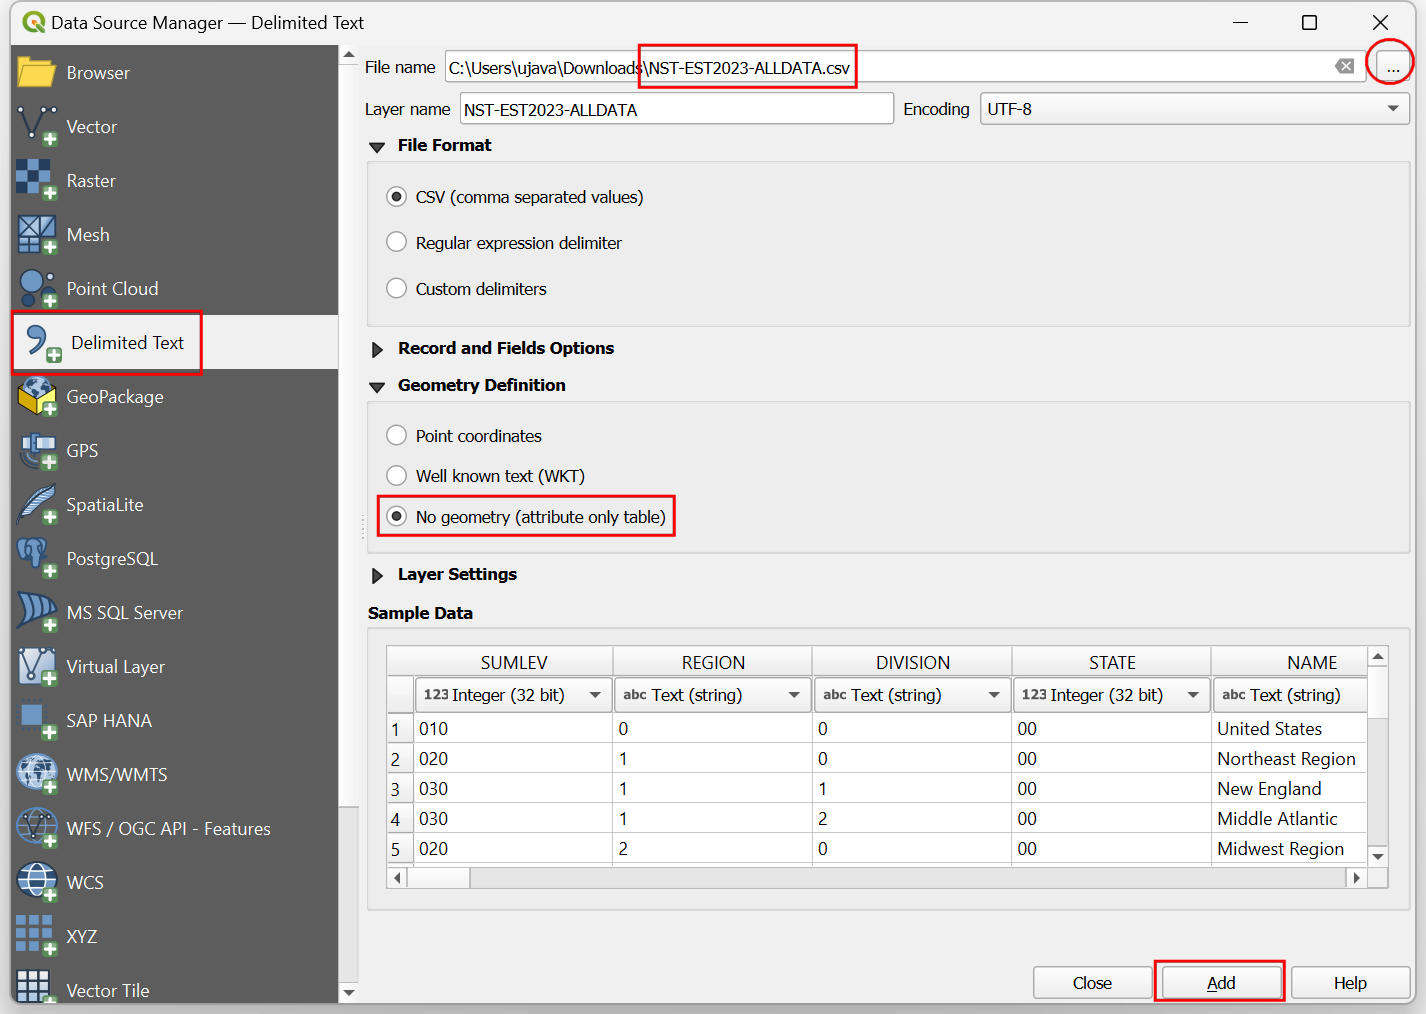
Schakel naar de tab Tekengescheiden tekst. Klik op de knop … naast Bestandsnaam en blader naar het gedownloade bestand
NST-EST2023-ALLDATA.csv. Vergroot het gedeelte Geometrie definitie en selecteerGeen geometrie (alleen attributentabel). Klik op Toevoegen.
Een nieuwe laag
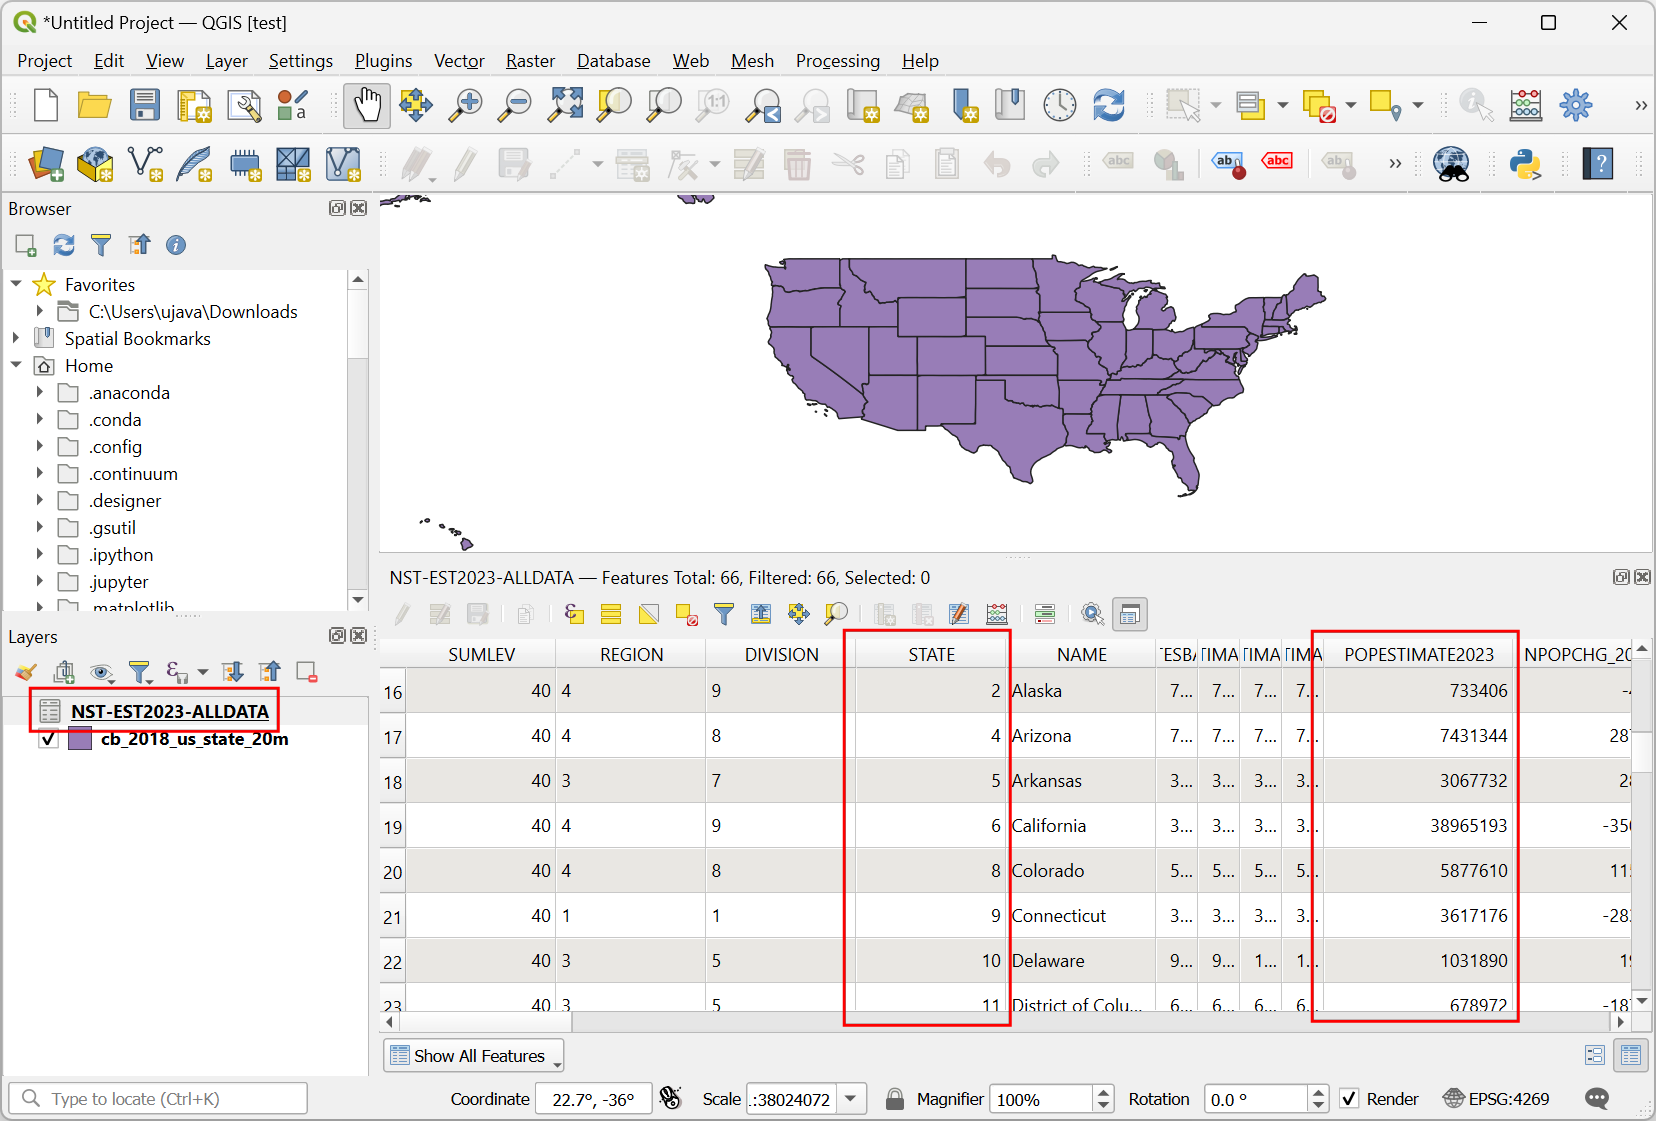
NST-EST2023-ALLDATAzal worden toegevoegd aan het paneel Lagen. Klik met rechts en selecteer Attributentabel openen. Deze tabel heeft de aantallen inwoners in de kolomPOPESTIMATE2023. Elke staat heeft een unieke ID in de kolomSTATE, die we zullen gebruiken om deze tabel samen te voegen met de polygoonlaag.
Klik met rechts op de laag
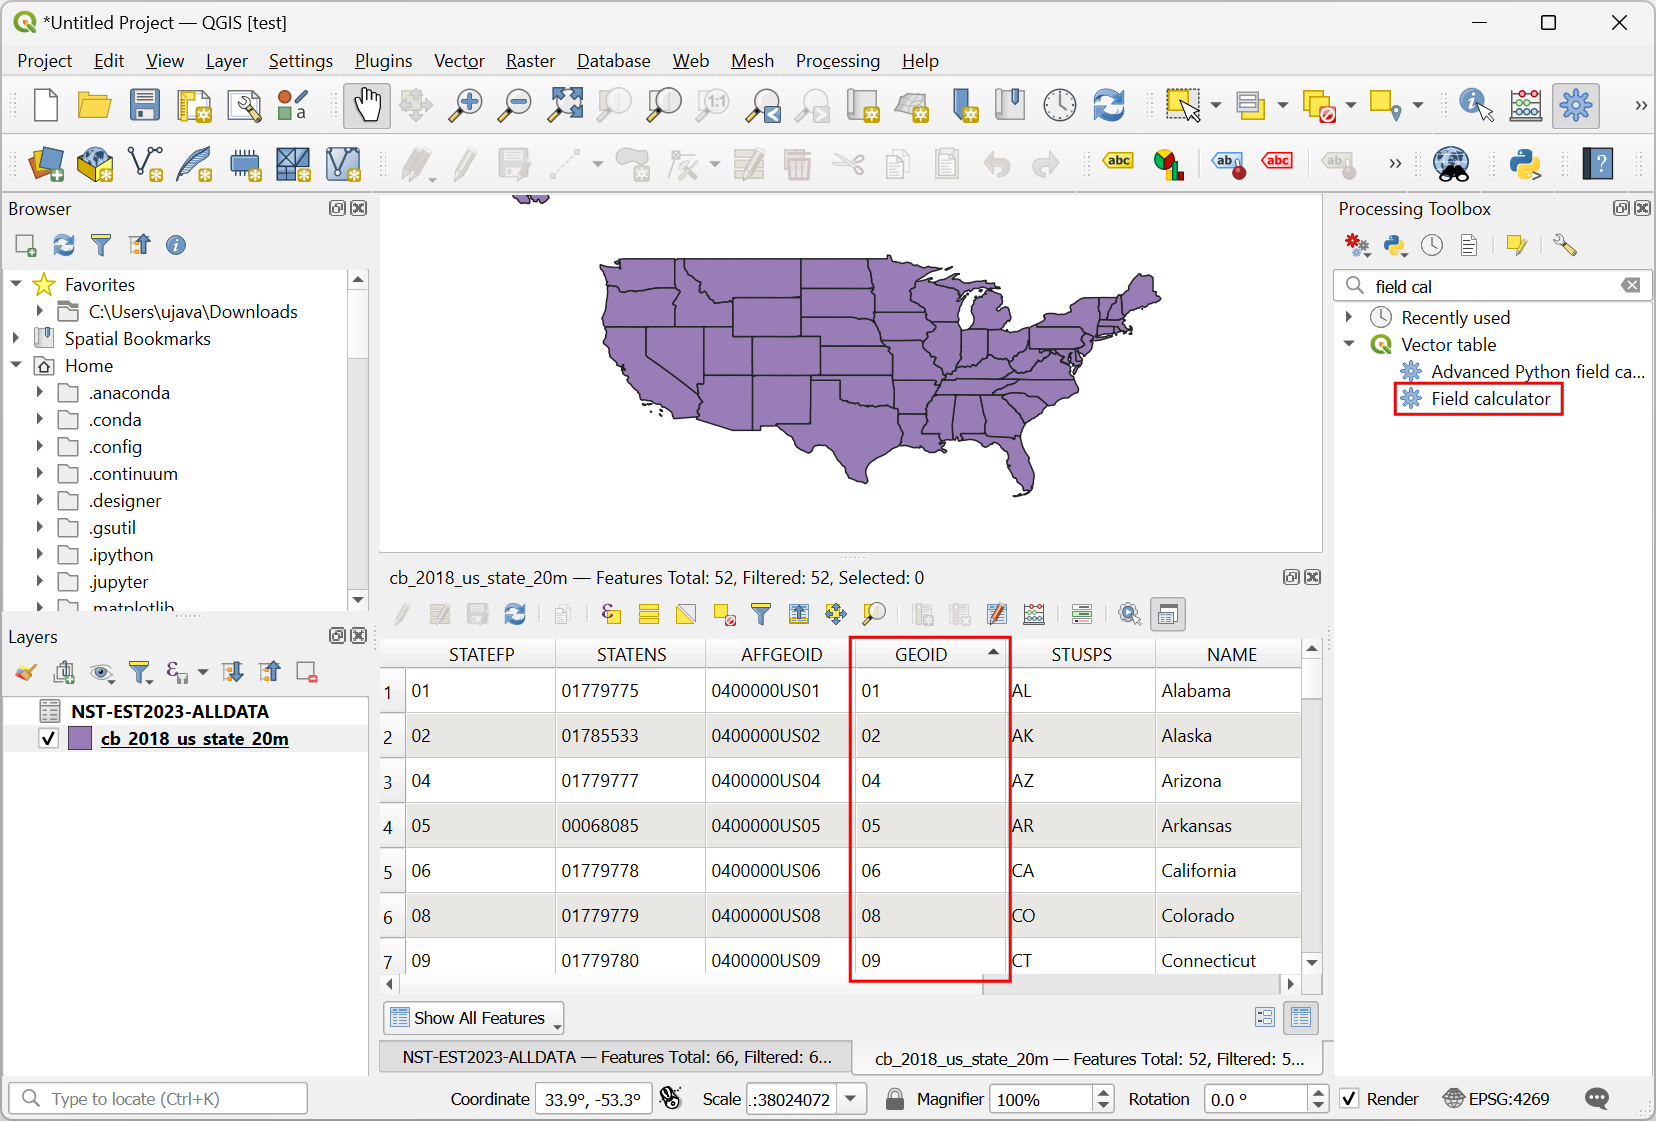
cb_2018_us_state_20men selecteer Attributentabel openen. De ID’s voor de staten zijn opgenomen in de kolomGEOID. Hoewel de getallen hetzelfde zijn, zijn zij opgemaakt als 2-cijferige, met voorloopnullen aangevulde getallen. We hebben dezelfde soort opgemaakte getallen nodig om deze overeen te laten komen met de kolomSTATEuit onze tabel met inwoners. SelecteerNST-EST2023-ALLDATA. Ga naar . Zoek en lokaliseer het algoritme . Dubbelklik erop om het te openen.
In het dialoogvenster Veld calculator, selecteer
NST-EST2023-ALLDATAals de Invoerlaag, voerGEOIDin als de Veldnaam, en stel Type resultaatveld ` in als ``Tekst (string)`. We zullen nu de getallen uit het veldSTATEnemen en de functielpad()gebruiken om een 2-cijferige tekenreeks, aangevuld met voorloopnullen te maken. Voer de volgende expressie in en klik op Uitvoeren
lpad("STATE", 2, '0')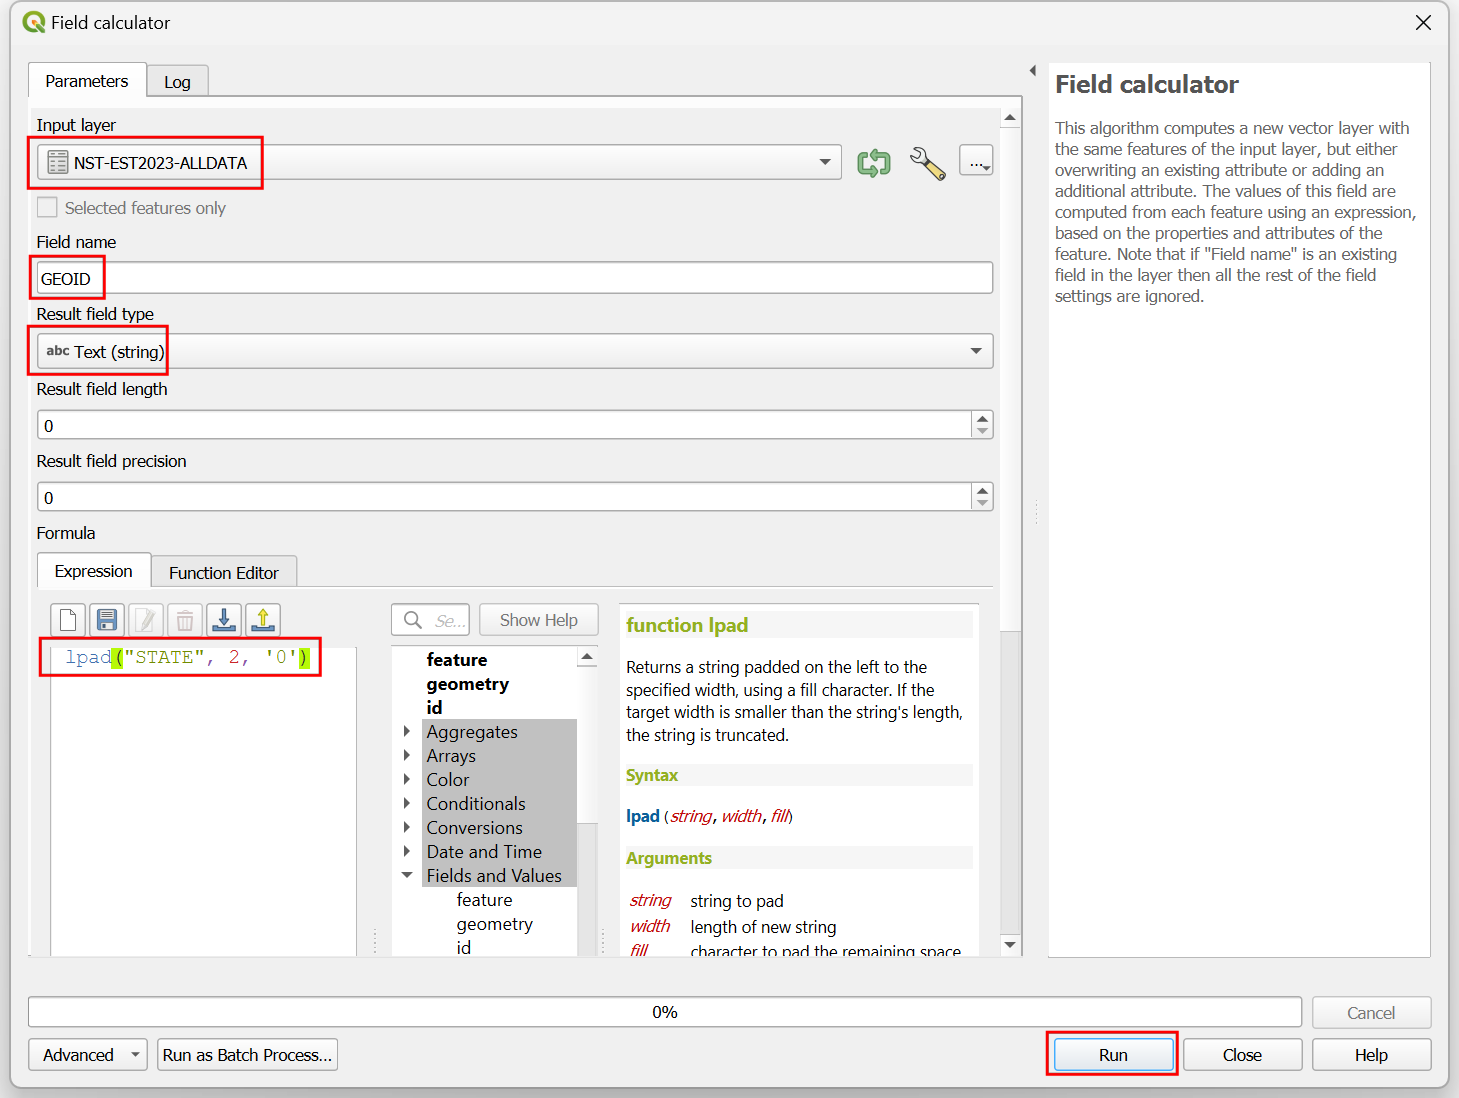
Een nieuwe laag
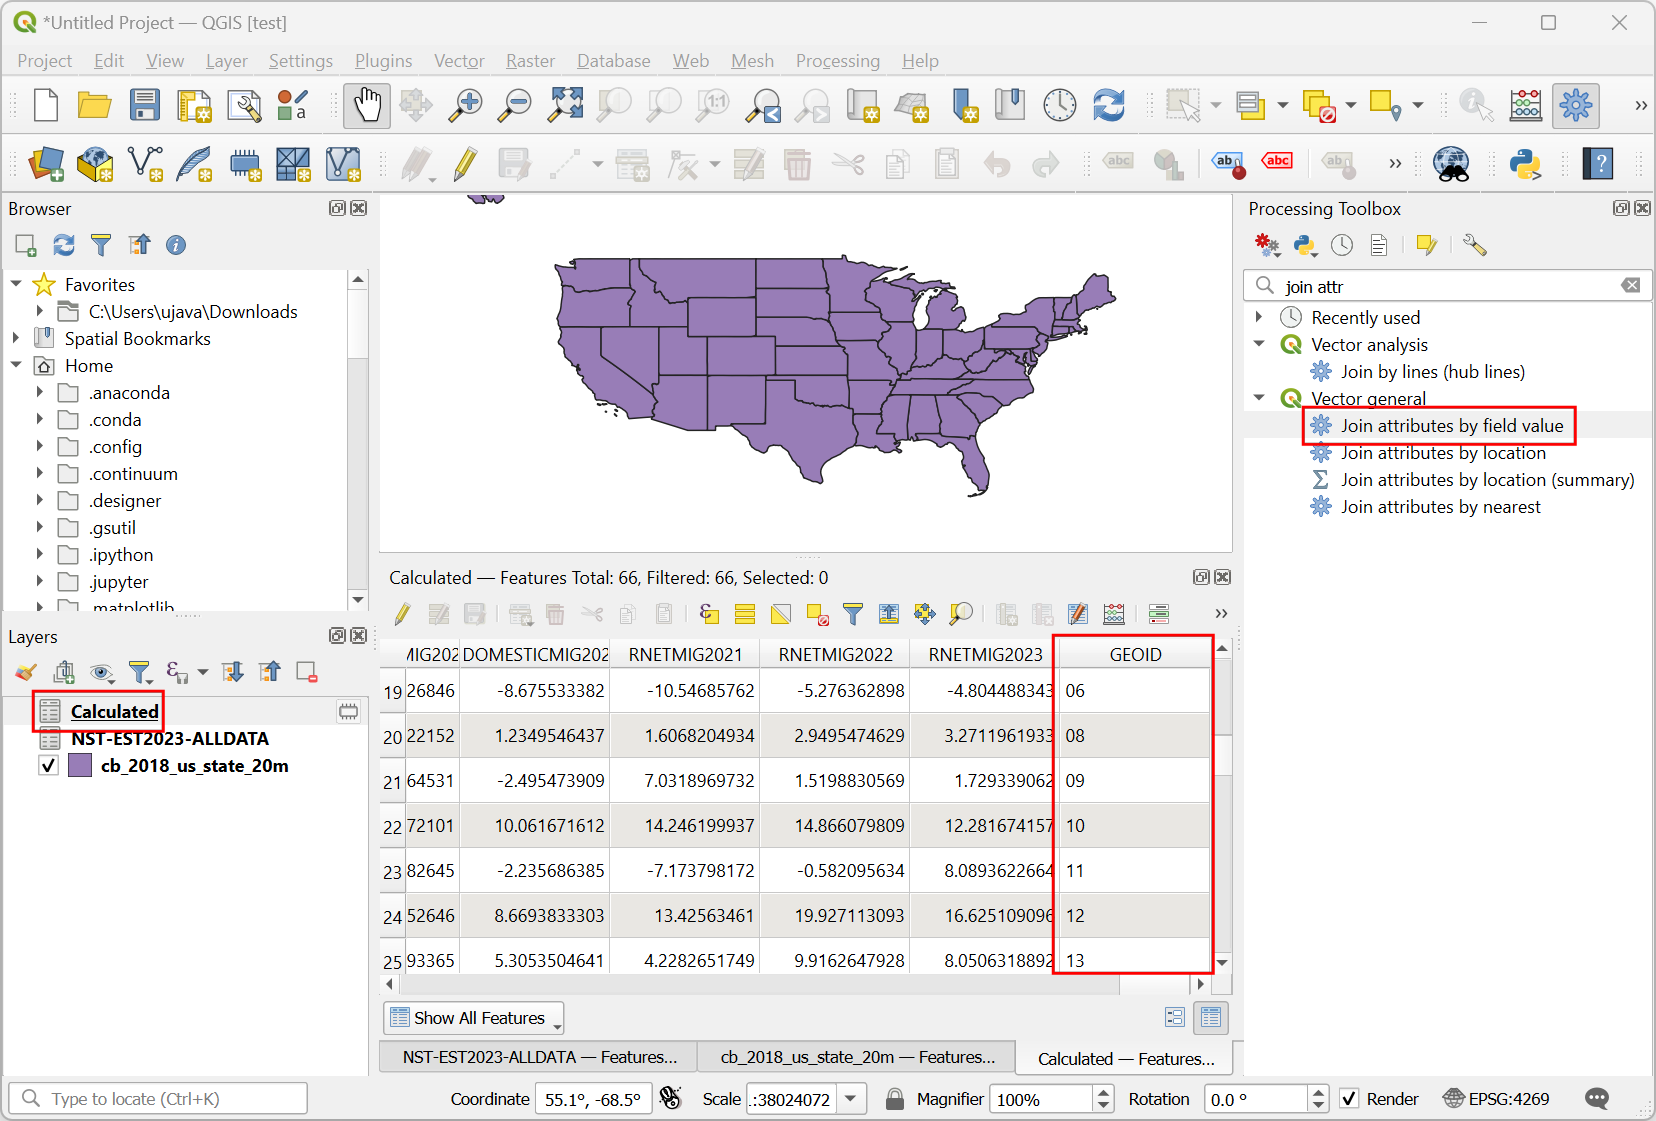
Berekendzal worden toegevoegd aan het paneel Lagen. Klik met rechts en selecteer Attributentabel openen. Merk op dat de nieuw gemaakte kolomGEOIDde correct opgemaakte identificaties heeft. We kunnen nu dat veld gebruiken om deze tabel samen te voegen met de laag van de staten. Zoek en lokaliseer het algoritme . Dubbelklik erop om het te openen.
In het dialoogvenster Attributen koppelen op veldwaarde, selecteer
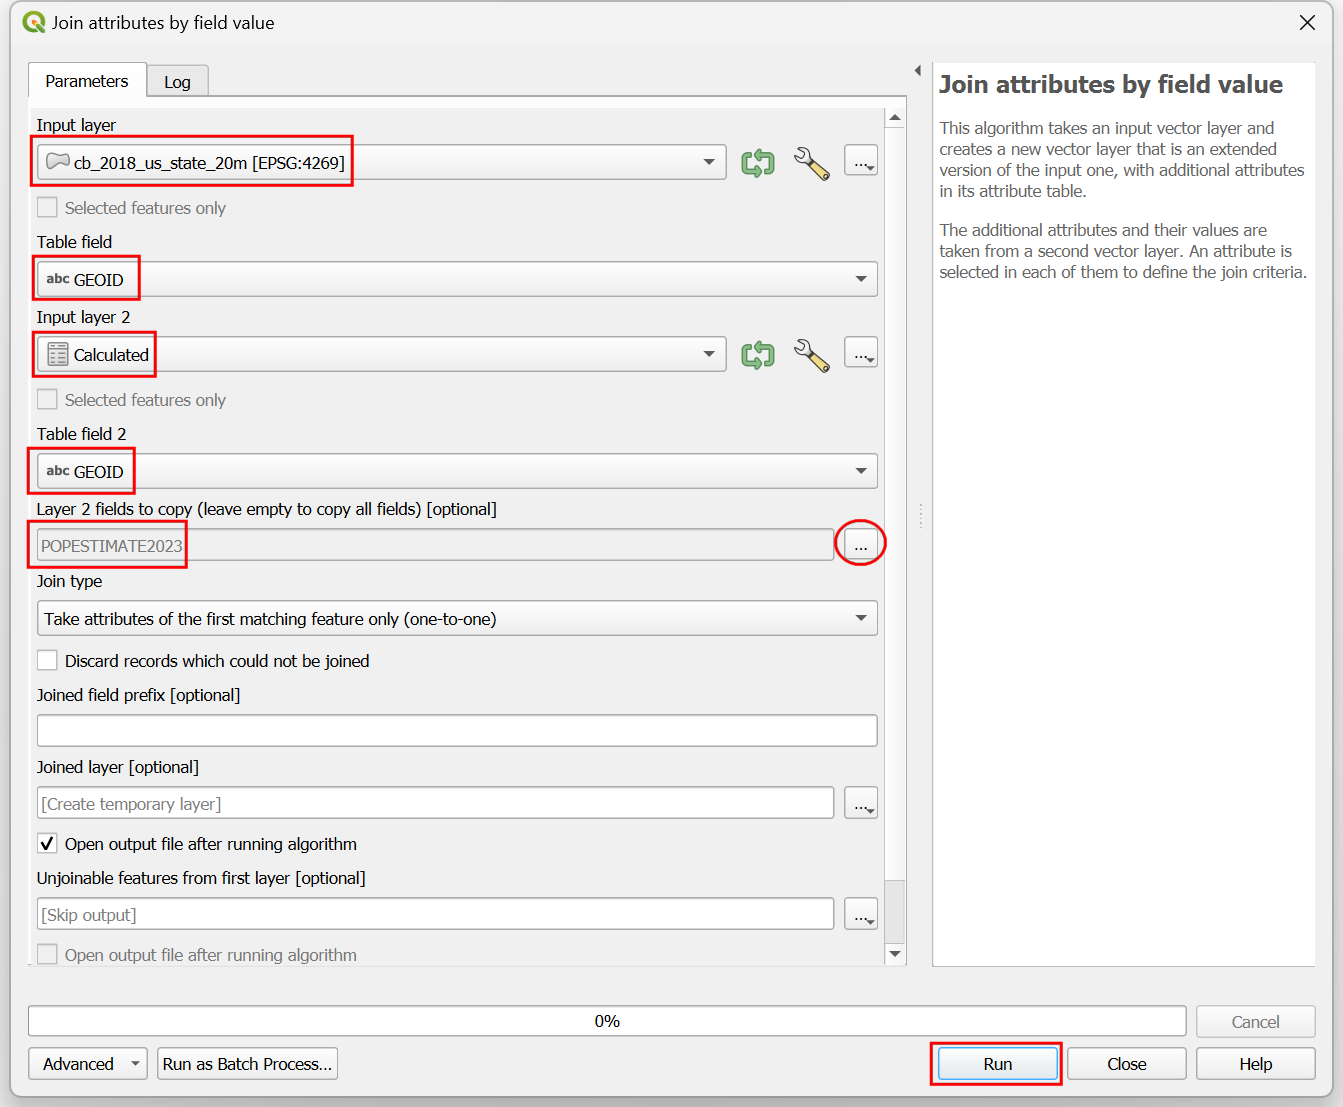
cb_2018_us_state_20mals de Invoerlaag. SelecteerGEOIDals het Tabelveld. Voor Invoerlaag 2, selecteer onze tabelBerekenden voor Tabelveld 2, selecteerGEOID. De tabel heeft heel veel kolommen, maar we hebben alleen het aantal inwoners van het laatste jaar nodig. Klik op de knop … voor Velden van laag 2 om te kopiëren en selecteer alleen het veldPOPESTIMATE2023. Laat alle andere opties op hun standaardwaarde en klik op Uitvoeren.
Een nieuwe laag
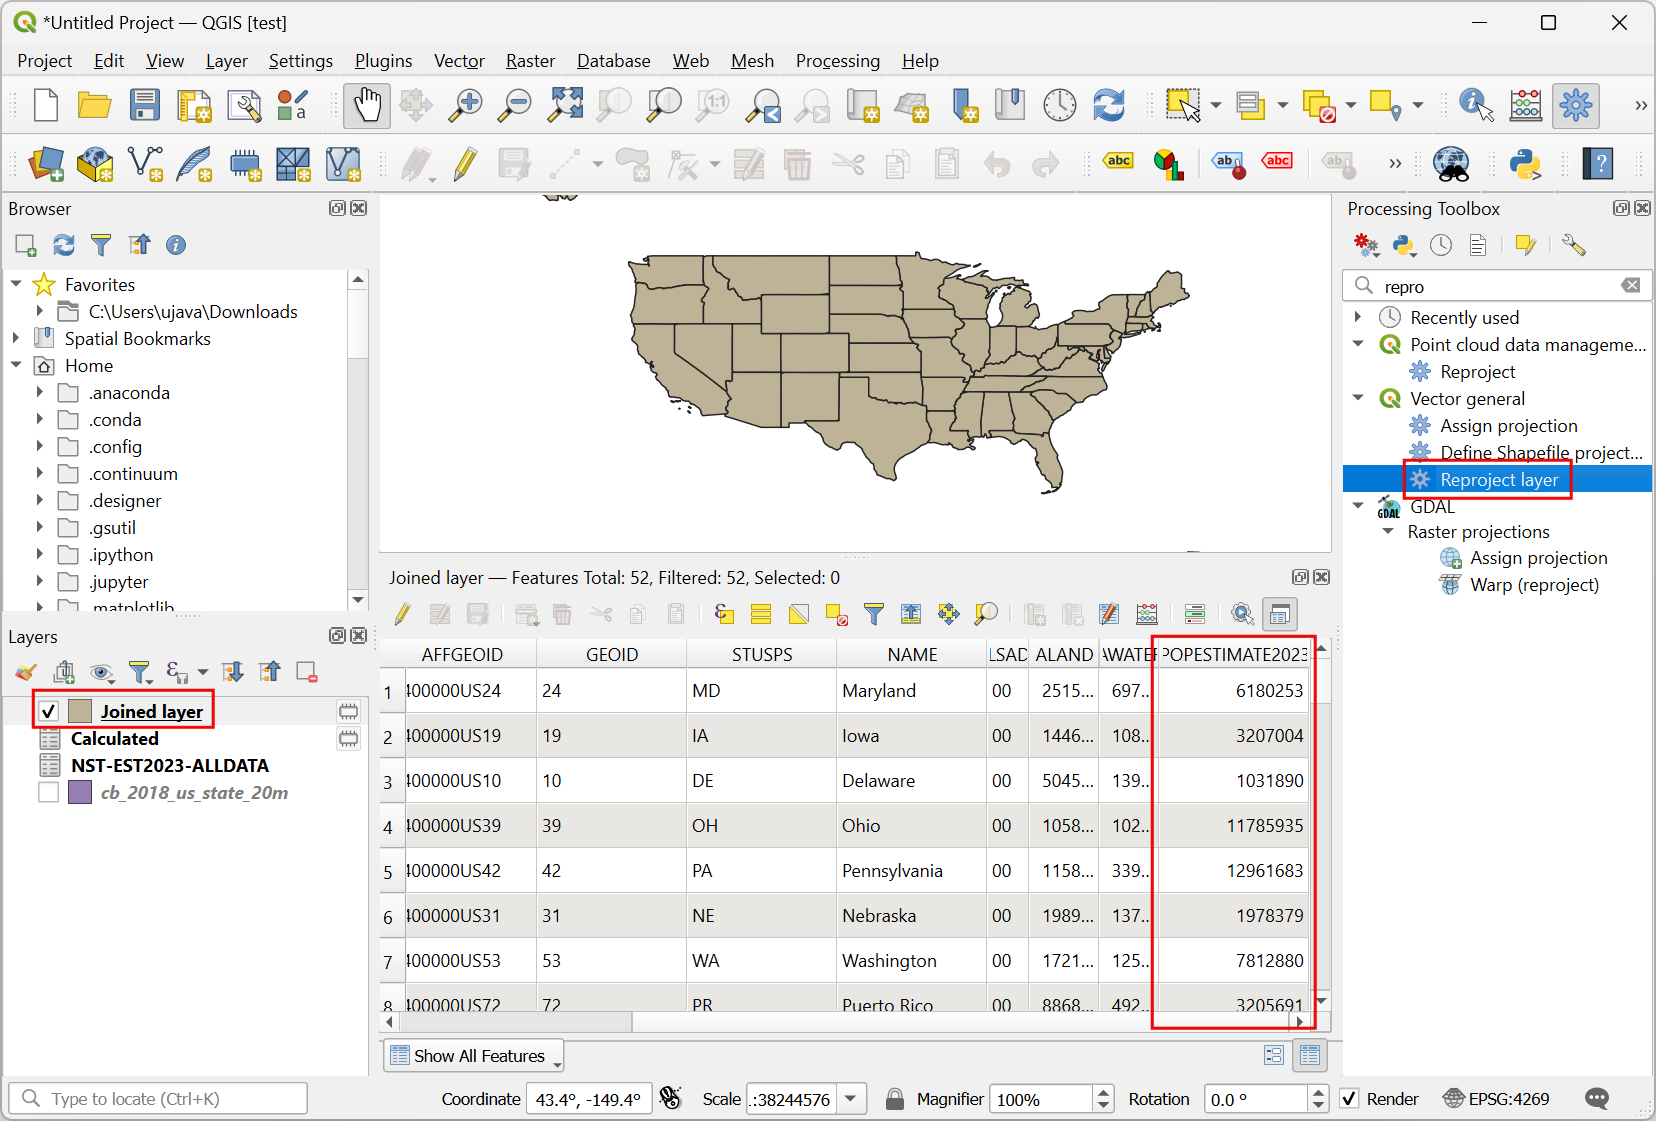
Samengevoegde laagzal worden toegevoegd aan het paneel Lagen. Laten we, voordat we deze laag gebruiken voor ons cartogram, die opnieuw projecteren naar een geprojecteerd CRS. Zoek en lokaliseer het algoritme . Dubbelklik erop om het te openen.
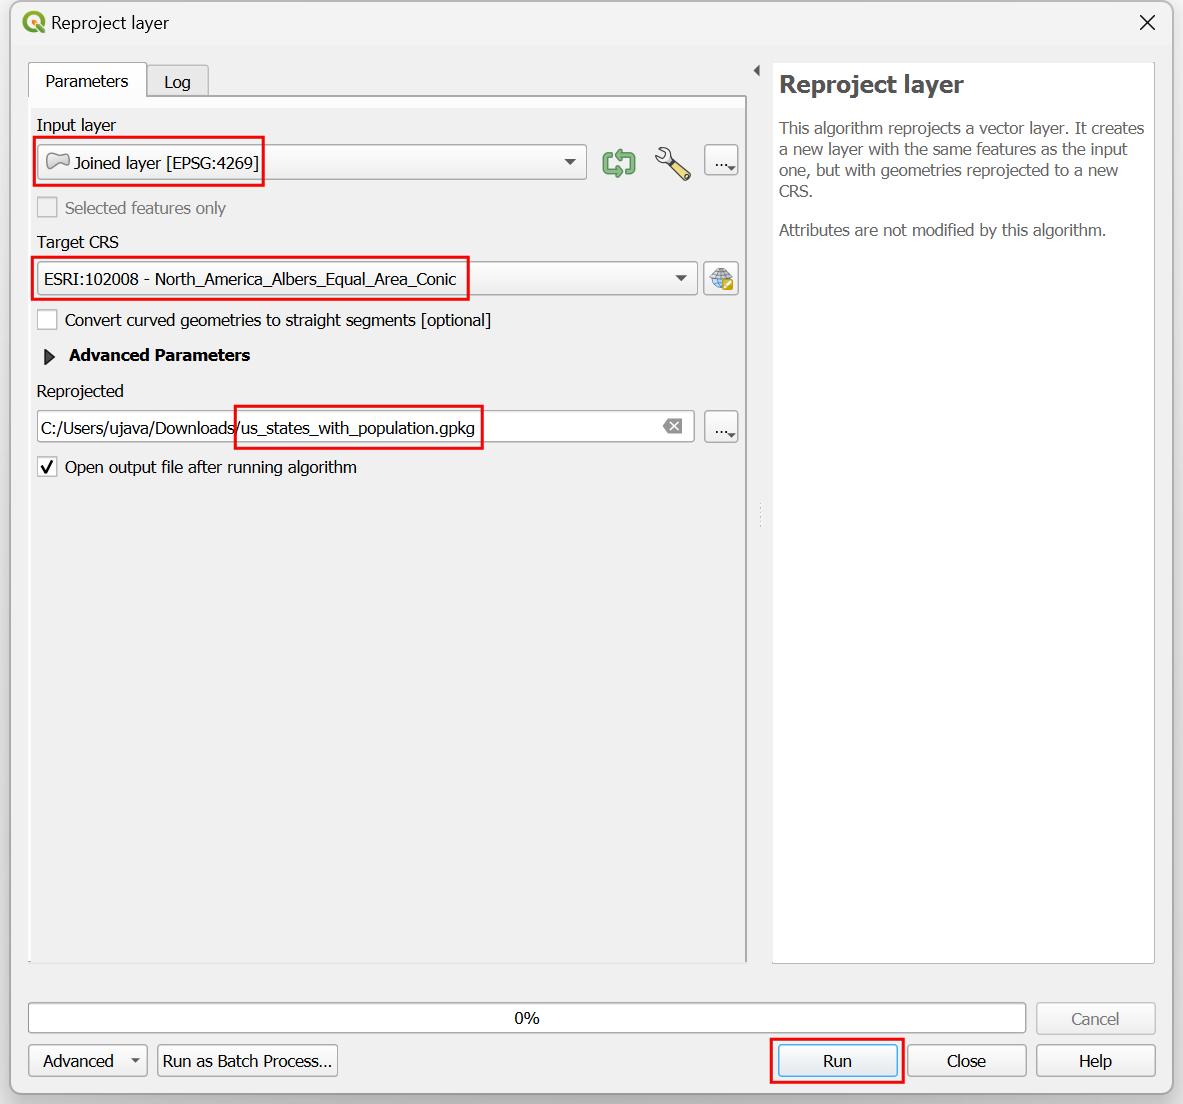
In het dialoogvenster Laag opnieuw projecteren, selecteer
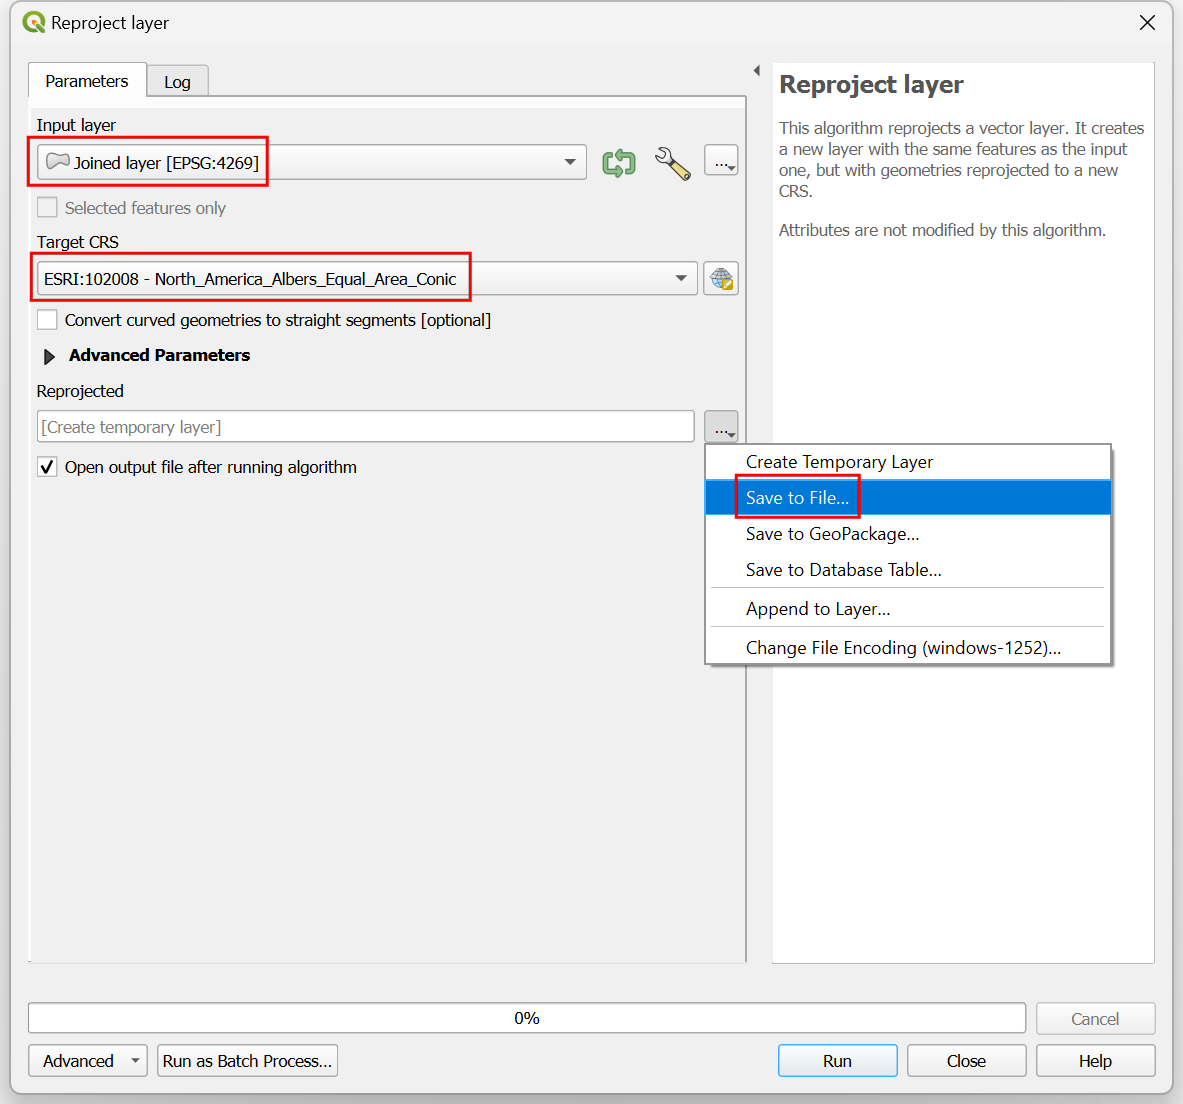
Samengevoegde laagals de Invoerlaag. Klik, voor het Doel-CRS, op de knop CRS selecteren. Zoek naar het CRSNorth_America_Albers_Equal_Area_Conicen selecteer dat. Dit is onze uiteindelijke laag, dus zullen we die opslaan op schijf. Klik op de knop … naast Opnieuw geprojecteerd en selecteer Opslaan als bestand….
Voer als naam voor de laag in
us_states_with_population.gpkgen selecteer Opslaan. Klik op Uitvoeren om het bestand GeoPackage met de opnieuw geprojecteerde gegevens te maken.
We zullen deze laag gebruiken in het volgende gedeelte. Voor het gemak kunt u direct een kopie van bovenstaande laag downloaden vanaf hieronder:
us_states_with_population.gpkg
Gegevensbron [USCENSUS]
Procedure
Begin een nieuw project in QGIS. Lokaliseer het bestand
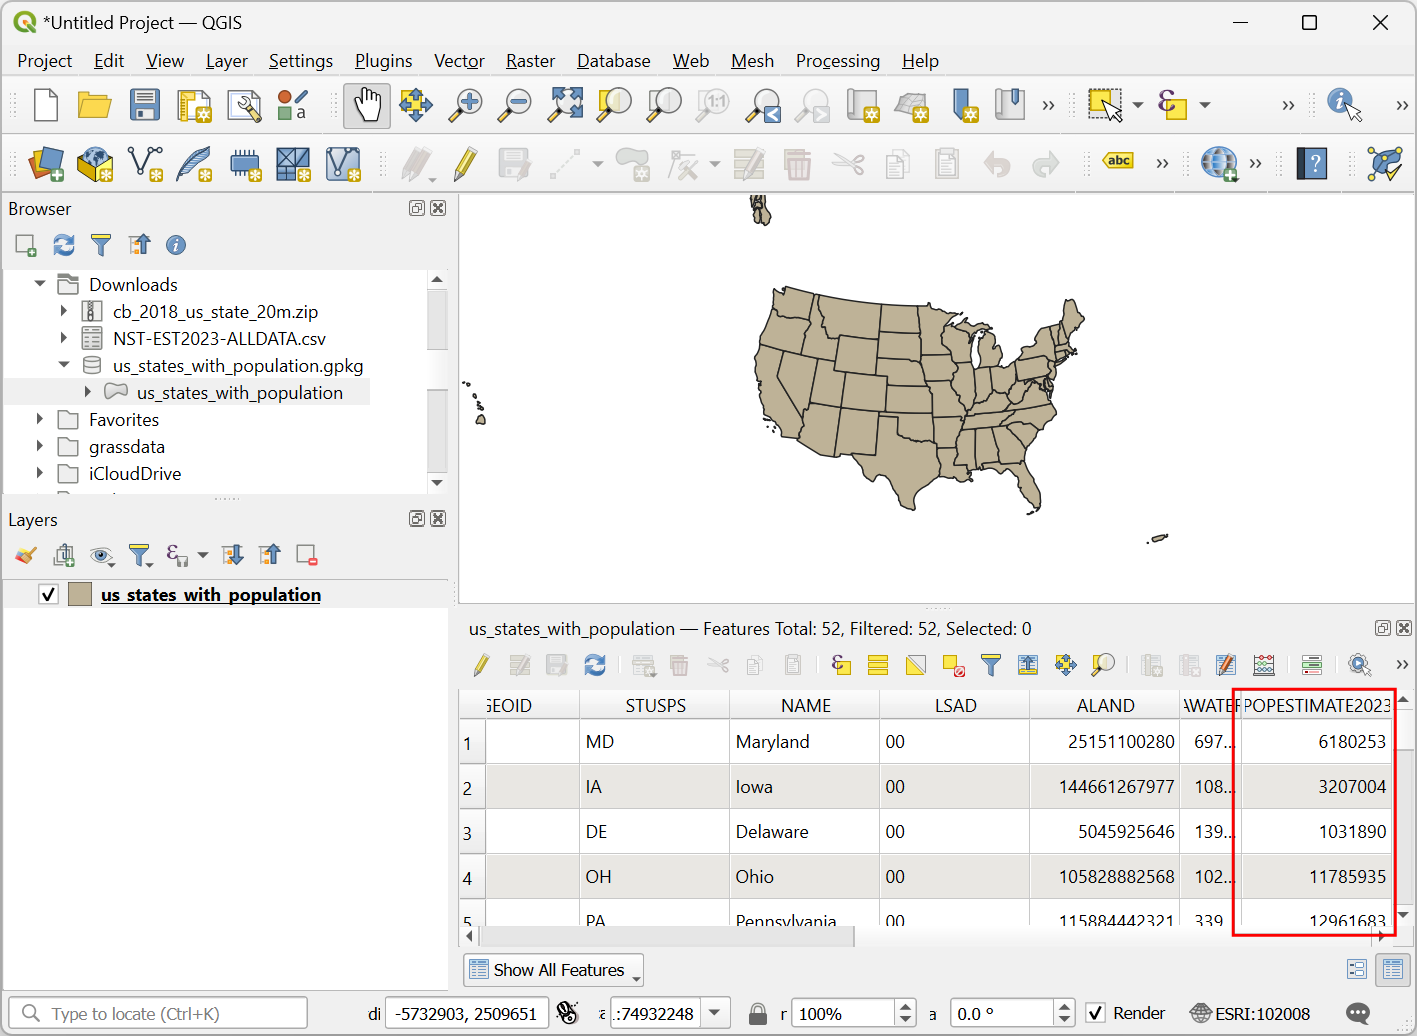
us_states_with_population.gpkgin de Browser en vergroot het. Sleep de laagus_states_with_populationin het lege kaartvenster en zet hem daar neer.
Een nieuwe laag
us_states_with_populationzal worden toegevoegd aan het paneel Lagen. Klik met rechts en selecteer Attributentabel openen. Voor ons cartogram willen we de dichtheid van de inwoners als de variabele gebruiken. We zullen de waarden voor de inwoners gebruiken in het veldPOPESTIMATE2023. Sluit de attributentabel.
Zoek en lokaliseer het algoritme in de Toolbox van Processing. Dubbelklik erop om het te starten.
In het dialoogvenster Veld calculator, selecteer
us_states_with_populationals de Invoerlaag. Voerdensityin als de Veldnaam. Voer de volgende expressie in om de dichtheid te berekenen. Omdat de functiearea(@geometry)het gebied berekent in de eenheid van het CRS (wat in meters is), passen we de conversiefactor toe om te converteren naar vierkante kilometers. Klik op Uitvoeren.
1000*1000* "POPESTIMATE2023" /
area(@geometry)
Klik op de knop … naast Berekend en selecteer Opslaan als bestand…. Voer de naam van de laag in als
us_states_population_density.gpkgen selecteer Opslaan. Klik op Uitvoeren.
Een nieuwe laag
us_states_population_densityzal worden toegevoegd aan het paneel Lagen. Klik met rechts en selecteer Attributentabel openen. We moeten een object Anker kiezen waartegen alle andere objecten op schaal zullen worden gebracht. Idealiter zou u het object kiezen met de hoogste waarde voor de variabele die u wilt gebruiken voor het cartogram. Dat zal ervoor zorgen dat er geen overlappende gebieden zijn. Dubbelklik op de kolomkop van density om de tabel op dichtheid te sorteren. U zult merken dat de hoogste waarde voor de dichtheid in onze gegevensset behoorlijk veel groter is in vergelijking tot de andere waarden en het behoort tot een redelijk kleine staat. Dat zal erin resulteren dat alle objecten op schaal zullen worden gebracht in hele kleine grootten. We kunnen het object kiezen met de op een na hoogste dichtheid, wat een behoorlijk groot gebied heeft en waarvan de dichtheid is te vergelijken met andere objecten.
In cartogrammen met gebieden bepaalt de schaalfactor hoeveel het gebied van het object wordt verkleind. We moeten het gebied van elk object verkleinen, zodat de dichtheid van de inwoners van het object hetzelfde is als de dichtheid van de inwoners van het anker-object. De formule voor de schaalfactor is de verhouding van de vierkantswortel van de waarde van het object ten opzichte van de vierkantswortel van de waarde van het anker-object. Open het algoritme uit de Toolbox van Processing. In het dialoogvenster Veld calculator, selecteer
us_states_population_densityals de Invoerlaag. Voerscale_factorin als de Veldnaam. Voer de volgende expressie in om de schaalfactor te berekenen. De expressie berekent de verhouding voor de vierkantswortel van de dichtheid van het object met de vierkantswortel van de dichtheid van de op een na grootste waarde voor de dichtheid. Klik op de knop … naast Berekend en selecteer Opslaan als bestand…. Voer als naam voor de laag inus_states_scale_factor.gpkgen selecteer Opslaan. Klik op Uitvoeren.
sqrt("density")/array_get(array_agg(
   expression:=sqrt("density"),
   order_by:=sqrt("density")), -2)
Een nieuwe laag
us_states_scale_factorzal worden toegevoegd aan het paneel Lagen. Klik met rechts en selecteer Attributentabel openen. Het veldscale_factorbevat nu de verhouding waarmee elk object op schaal moet worden gebracht om dezelfde dichtheid van inwoners te hebben als het anker-object=.
We hebben alleen de laag
us_states_scale_factornodig voor de uiteindelijke visualisatie. Selecteer de overblijvende lagen, klik met rechts en selecteer Laag verwijderen.
Selecteer de laag
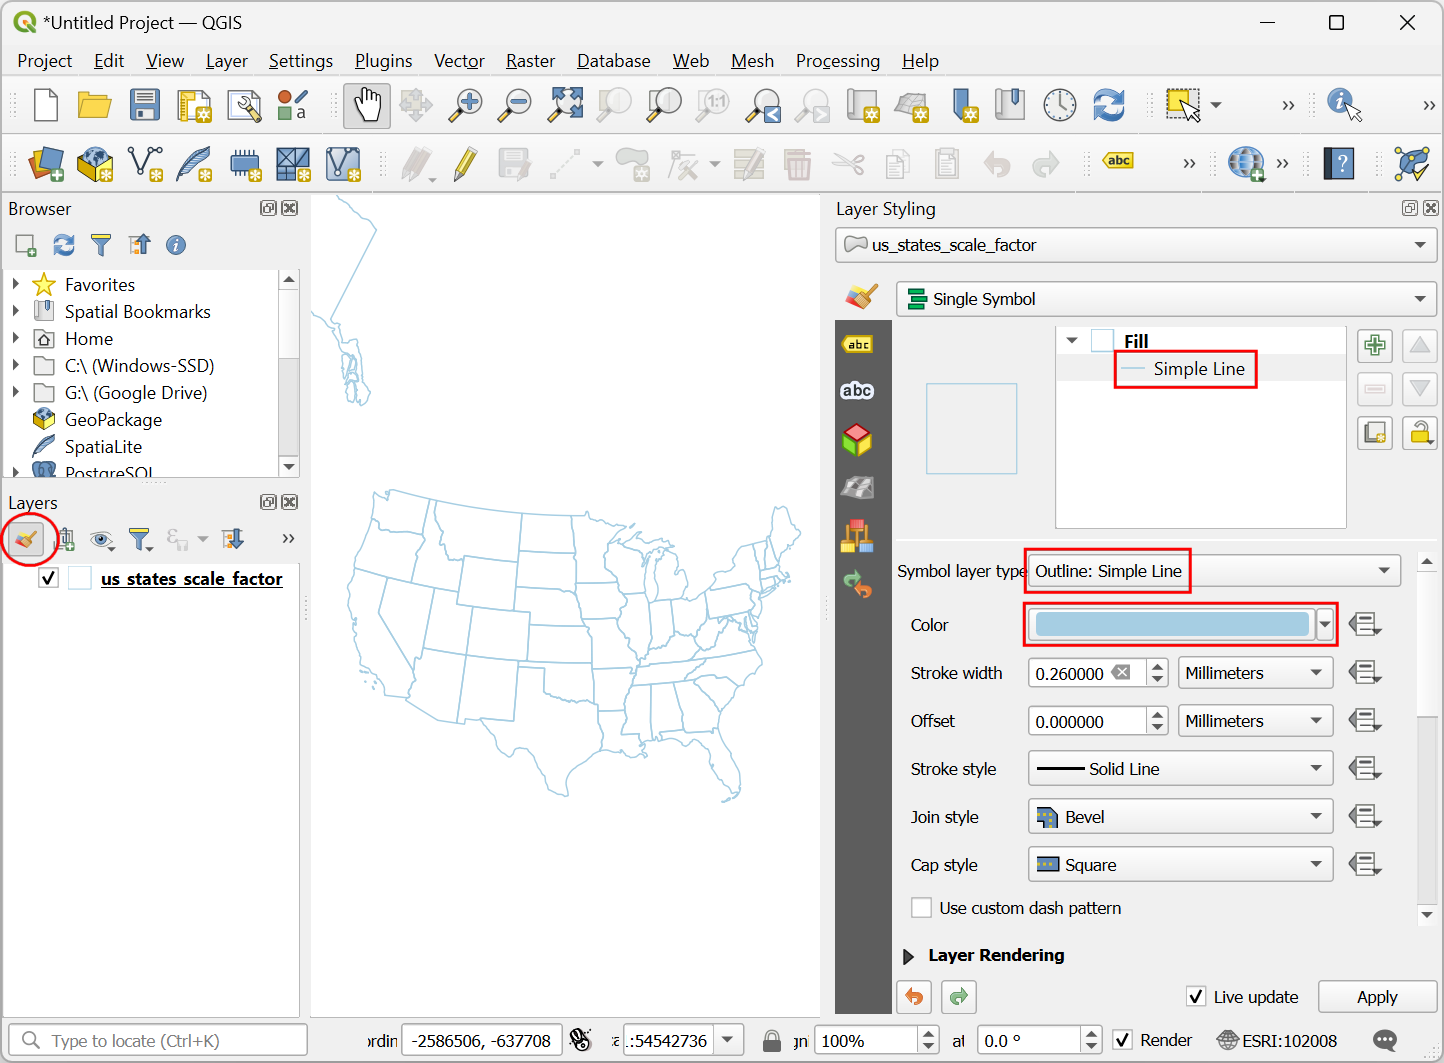
us_states_scale_factoren klik op de knop Paneel Laag opmaken openen in het paneel Lagen. Selecteer Standaard vulling en open de keuzeselectie voor Symboollaagtype. Stel het Symboollaagtype in opRand: Doorgetrokken lijnen selecteer een Kleur van uw keuze. Deze symboollaag zal een verwijzing zijn voor onze kaart als we de grootten van de polygonen wijzigen.
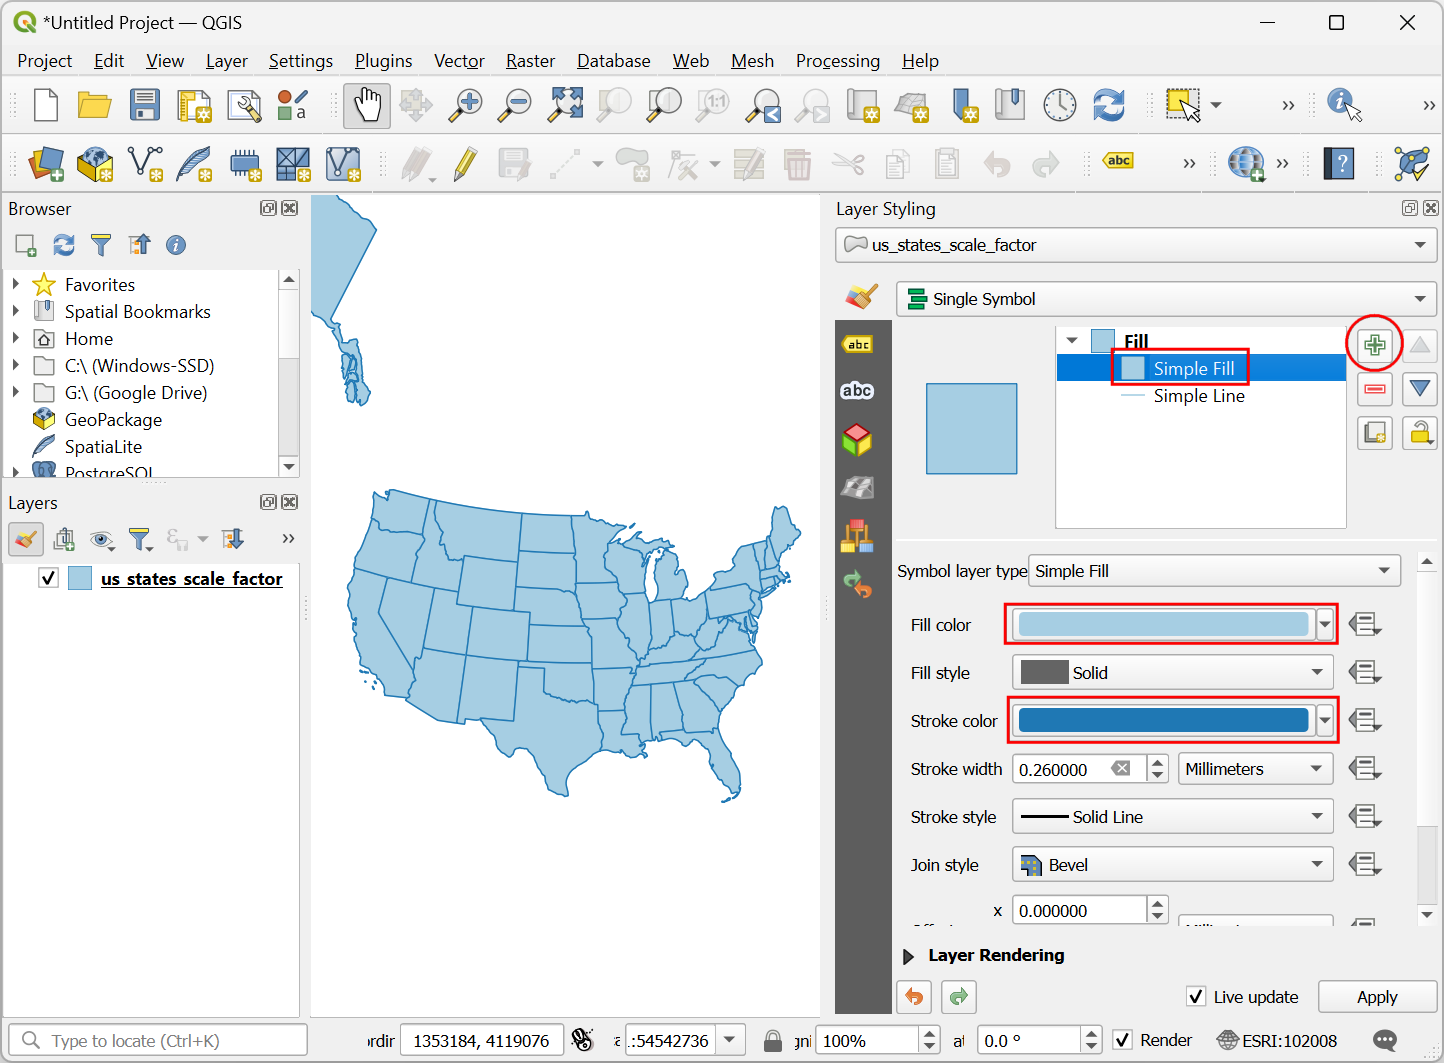
Klik op de knop Symboollaag toevoegen (+). Een nieuwe symboollaag Standaard vulling zal worden toegevoegd. Stel de Vulkleur in op dezelfde kleur als de lijnen en de Lijnkleur op een iets donkerder kleur.
Open vervolgens de keuzeselectie voor Symboollaagtype en selecteer
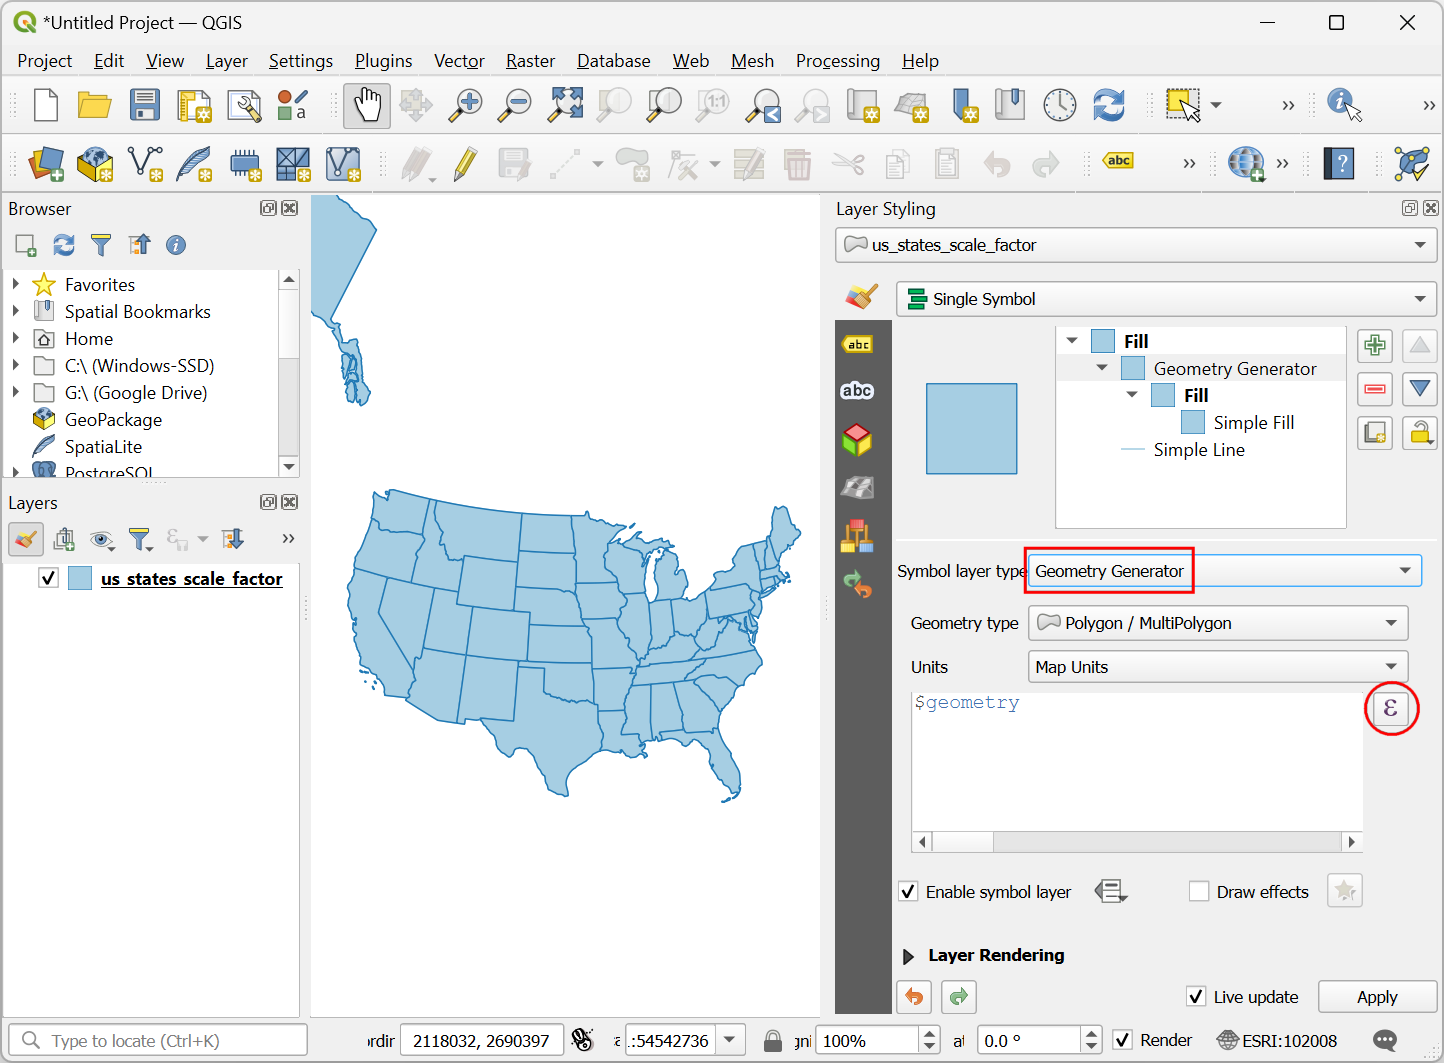
Geometrie-generatorals het Symboollaagtype. Geometrie-generator stelt ons in staat de geometrie voor het renderen aan te passen met expressies. Klik op de knop Expressiebouwer.
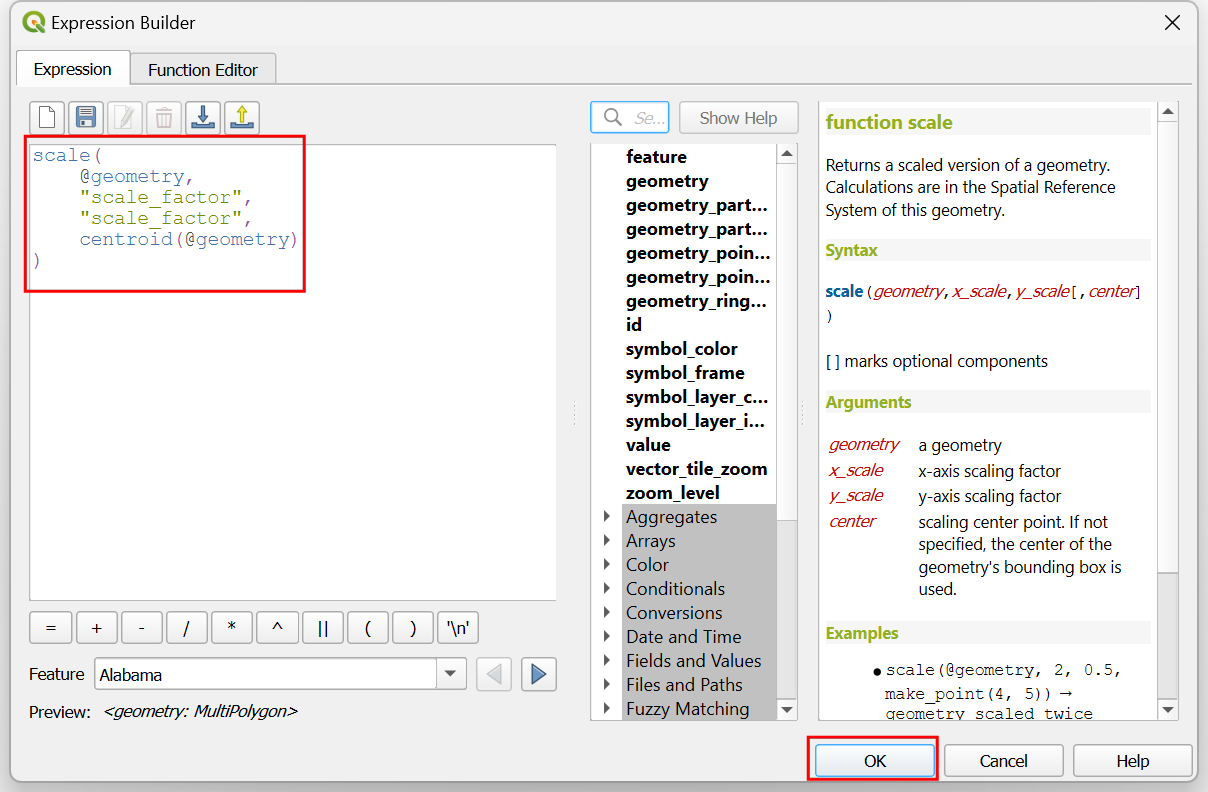
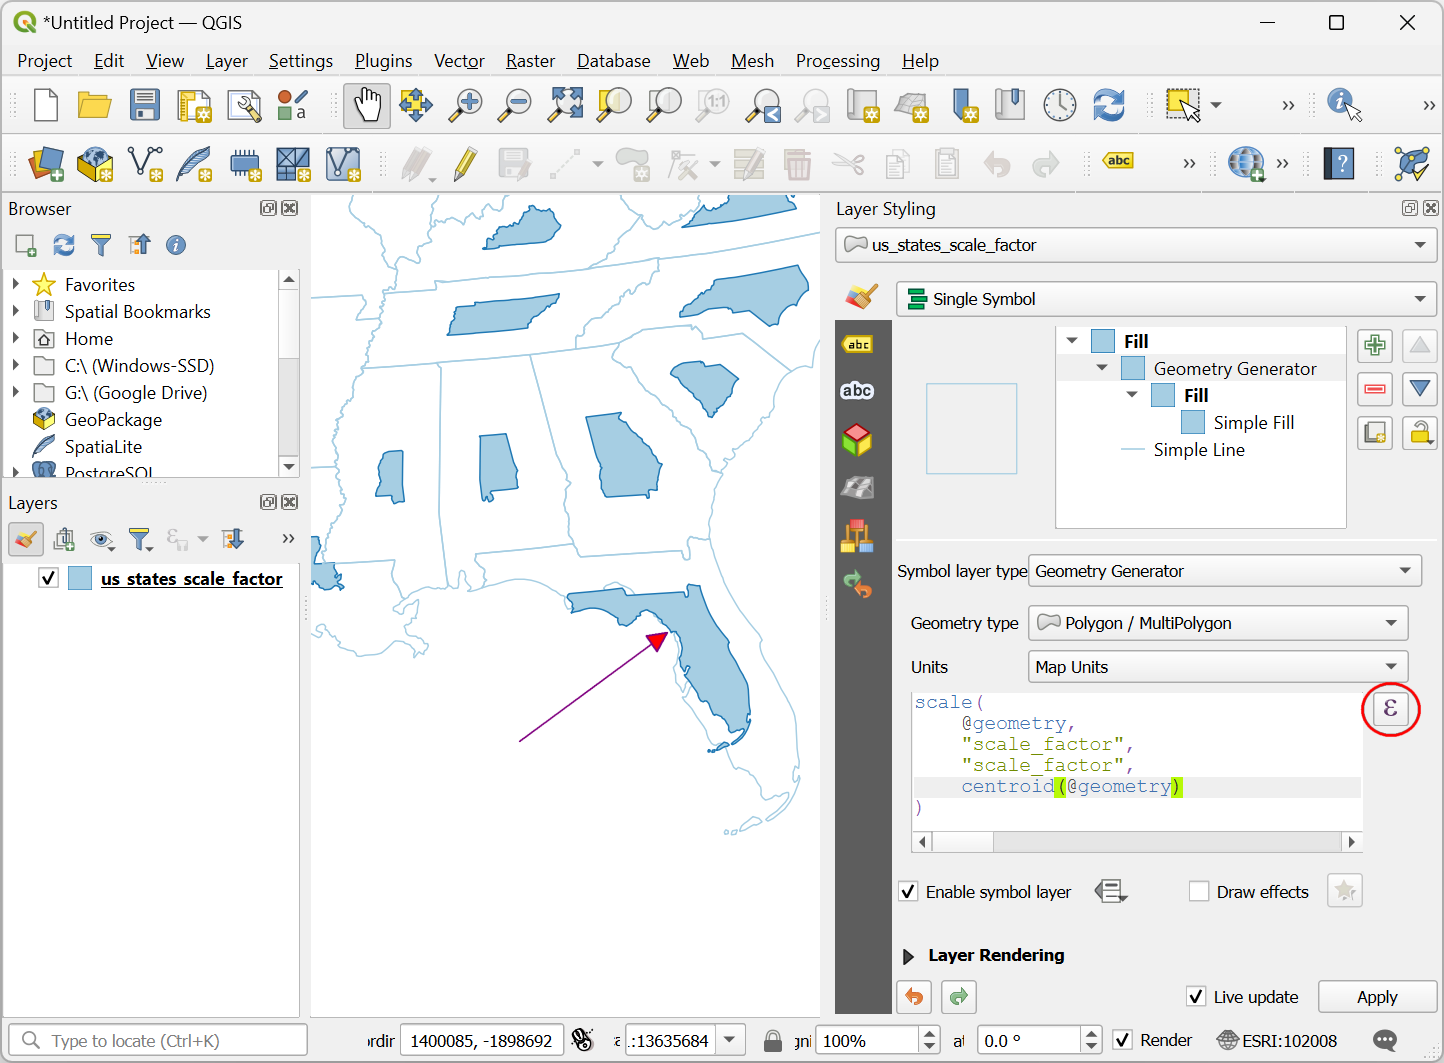
We zullen de functie scale() gebruiken die de opgegeven geometrie in grootte wijzigt met de opgegeven X- en Y-factoren voor het op schaal brengen. Voor ons cartogram, willen we elke polygoon opnieuw op grootte brengen in verhouding met zijn inwoneraantal voor het hoogste aantal inwoners. Voer de volgende expressie in om dit op schaal brengen toe te passen en klik op OK.
scale(
   @geometry,
   "scale_factor",
   "scale_factor",
   centroid(@geometry)
)
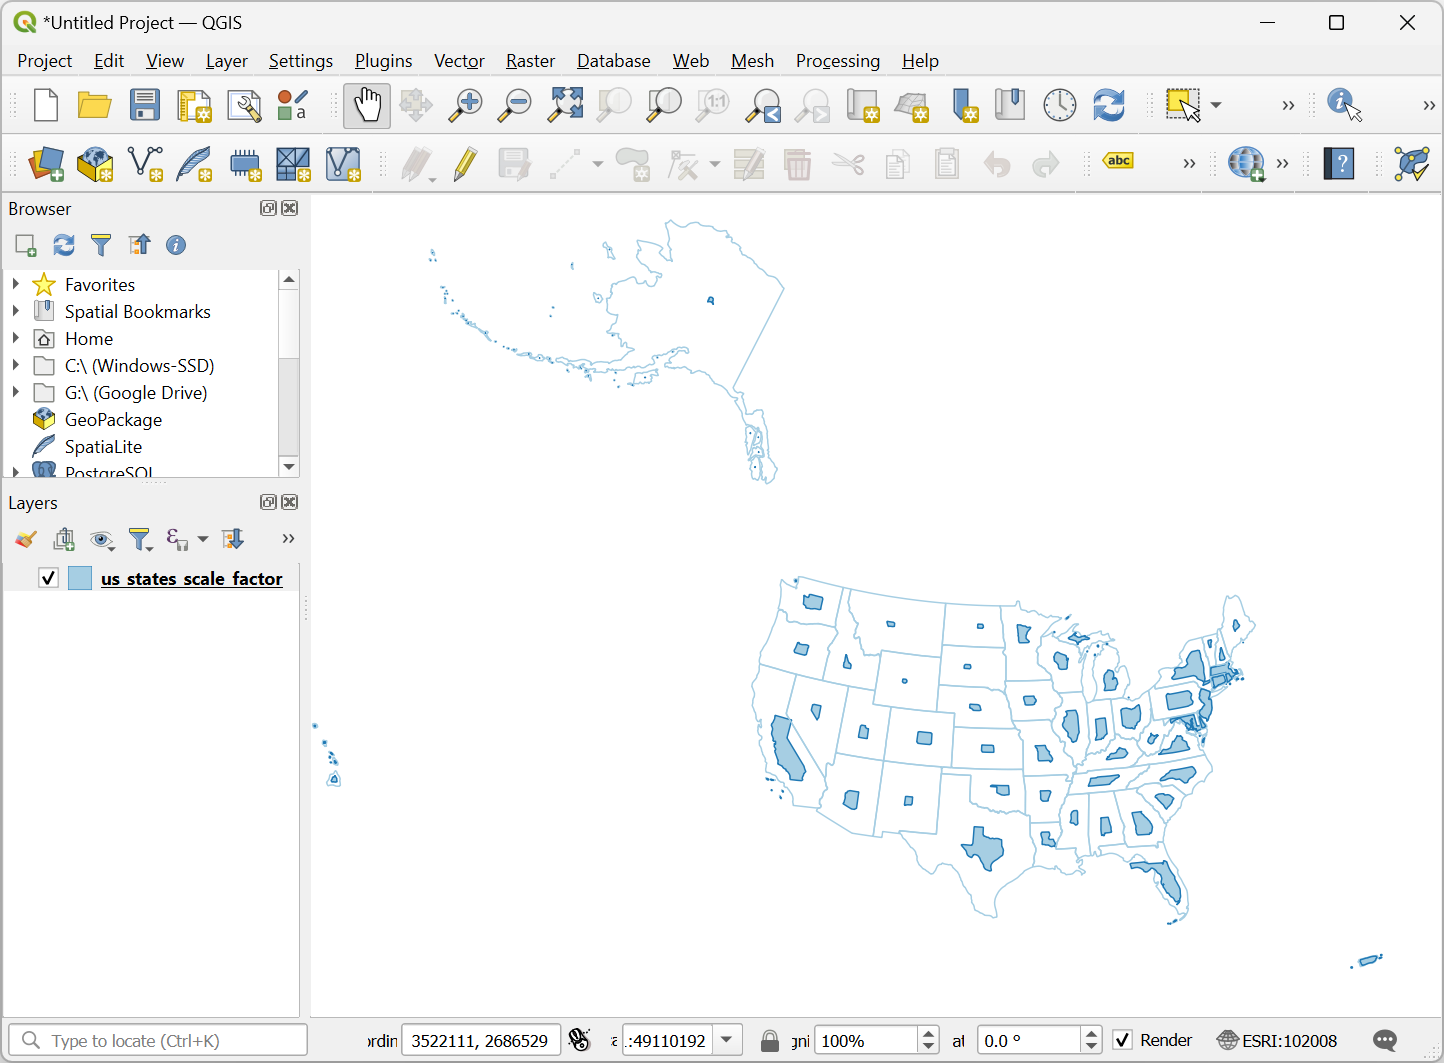
U zult nu zien dat de polygonen van de staten nu op grootte zijn gebracht naar de verhouding van de inwoneraantallen van elke staat ten opzichte van het hoogste inwoneraantal. Veel grote staten met lage dichtheid van inwoners zijn nu veel kleiner dan hun originele grootte. Het zal u opvallen dat polygonen met onregelmatige vormen uit het centrum liggen na het op schaal brengen. Dat komt omdat het ankerpunt van het op schaal brengen het zwaartepunt is van de geometrie, wat vaak het representatieve punt voor de polygoon is. Laten we onze expressie aanpassen om dit op te lossen. Klik op de knop Expressiebouwer.
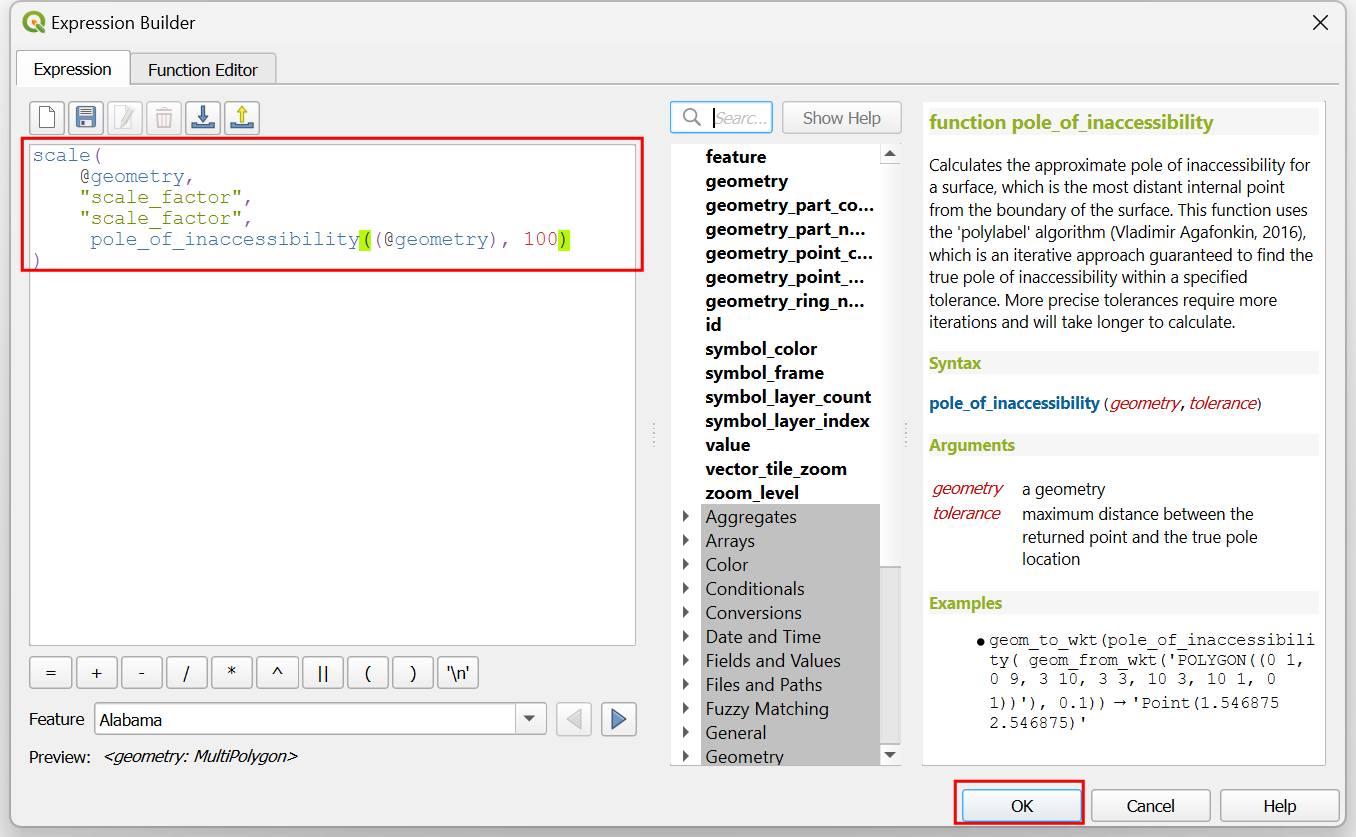
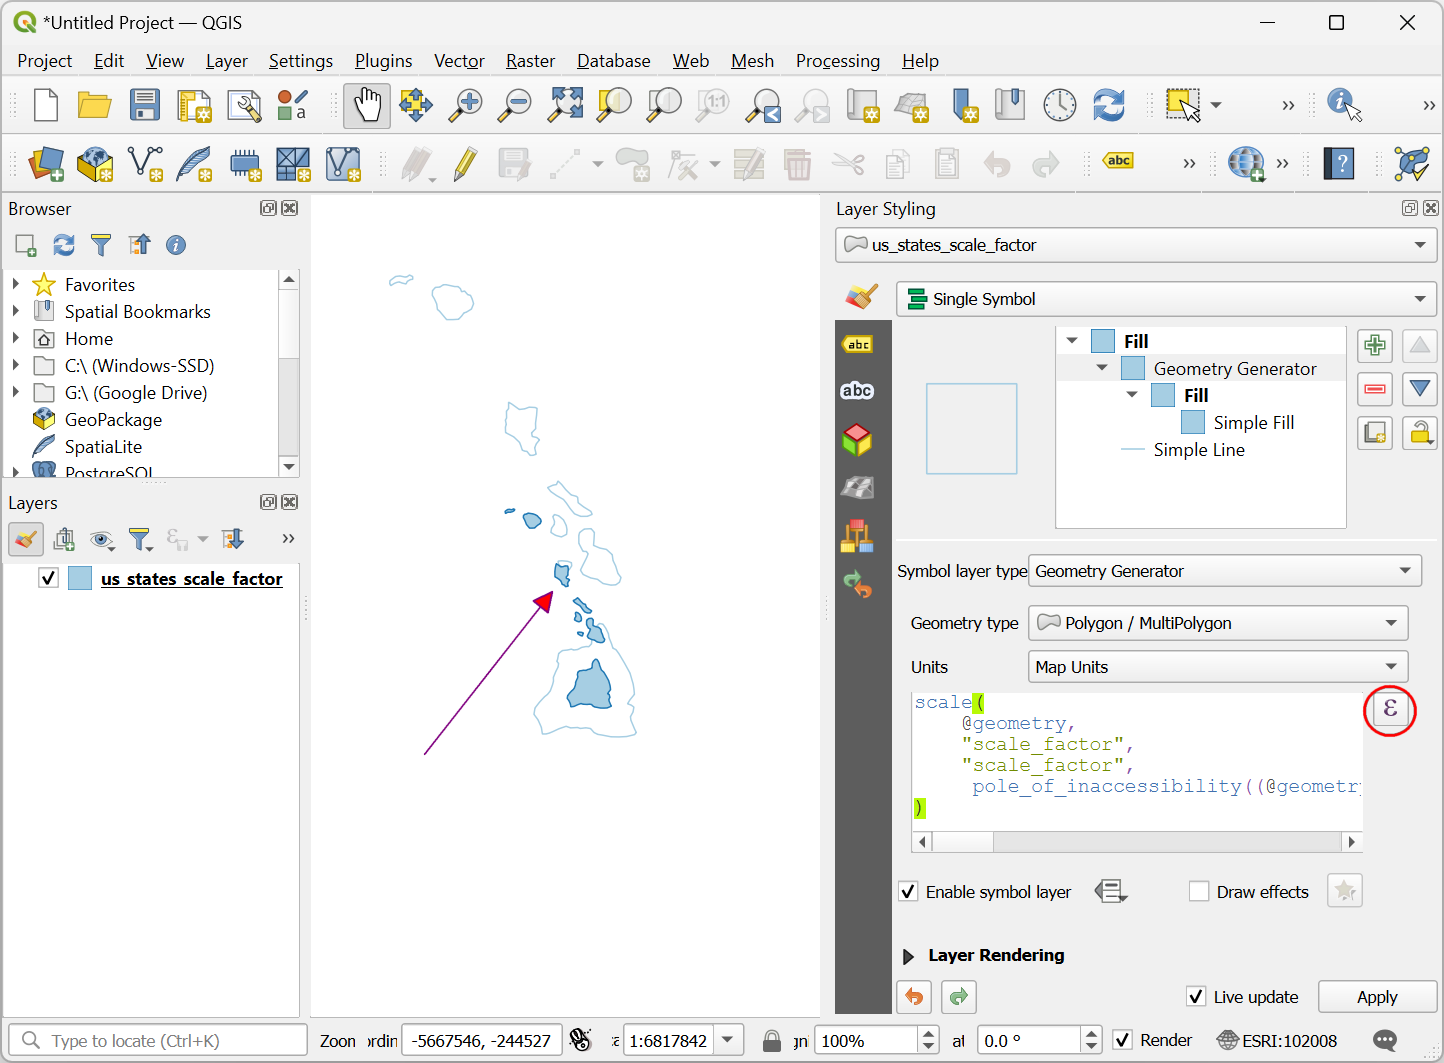
De functie scale() kan een optionele parameter bevatten om het middelpunt van het op schaal brengen te specificeren. We zullen de functie pole_of_inaccessibility() gebruiken om een representatief ankerpunt te zoeken voor elke polygoon. Dat is soortgelijk aan een zwaartepunt, maar het ligt gegarandeerd binnen de polygoon, terwijl een zwaartepunt er buiten kan vallen voor bepaalde vormen. Werk de expressie bij zoals hieronder, die de pool van ontoegankelijkheid van de geometrie berekent met een kleine tolerantiewaarde, en klik op OK.
scale(
    @geometry,
    "scale_factor",
    "scale_factor",
    pole_of_inaccessibility(@geometry, 100)
)
Nu zullen de op schaal gebrachte polygonen een veel betere plaatsing hebben. We zien echter ene ander probleem. Veel objecten op de laag zijn Multipolygonen, d.i. zij hebben meer dan een deel. Dergelijke objecten hebben 2 of meer delen die deel uitmaken van dezelfde geometrie. Met onze huidige expressie, worden beide op schaal gebracht met hetzelfde ankerpunt, dat wordt berekend uit de gecombineerde geometrie. Dit is niet ideaal. Bijvoorbeeld een groot object met meerdere eilanden zou zo op schaal moeten worden gebracht dat elk eiland op schaal wordt gebracht met zijn eigen middelpunt. We werken, om dit op te lossen, onze expressie door over elk deel van de geometrie te lopen en het op schaal te brengen met zijn eigen middelpunt. Klik op de knop Expressiebouwer.
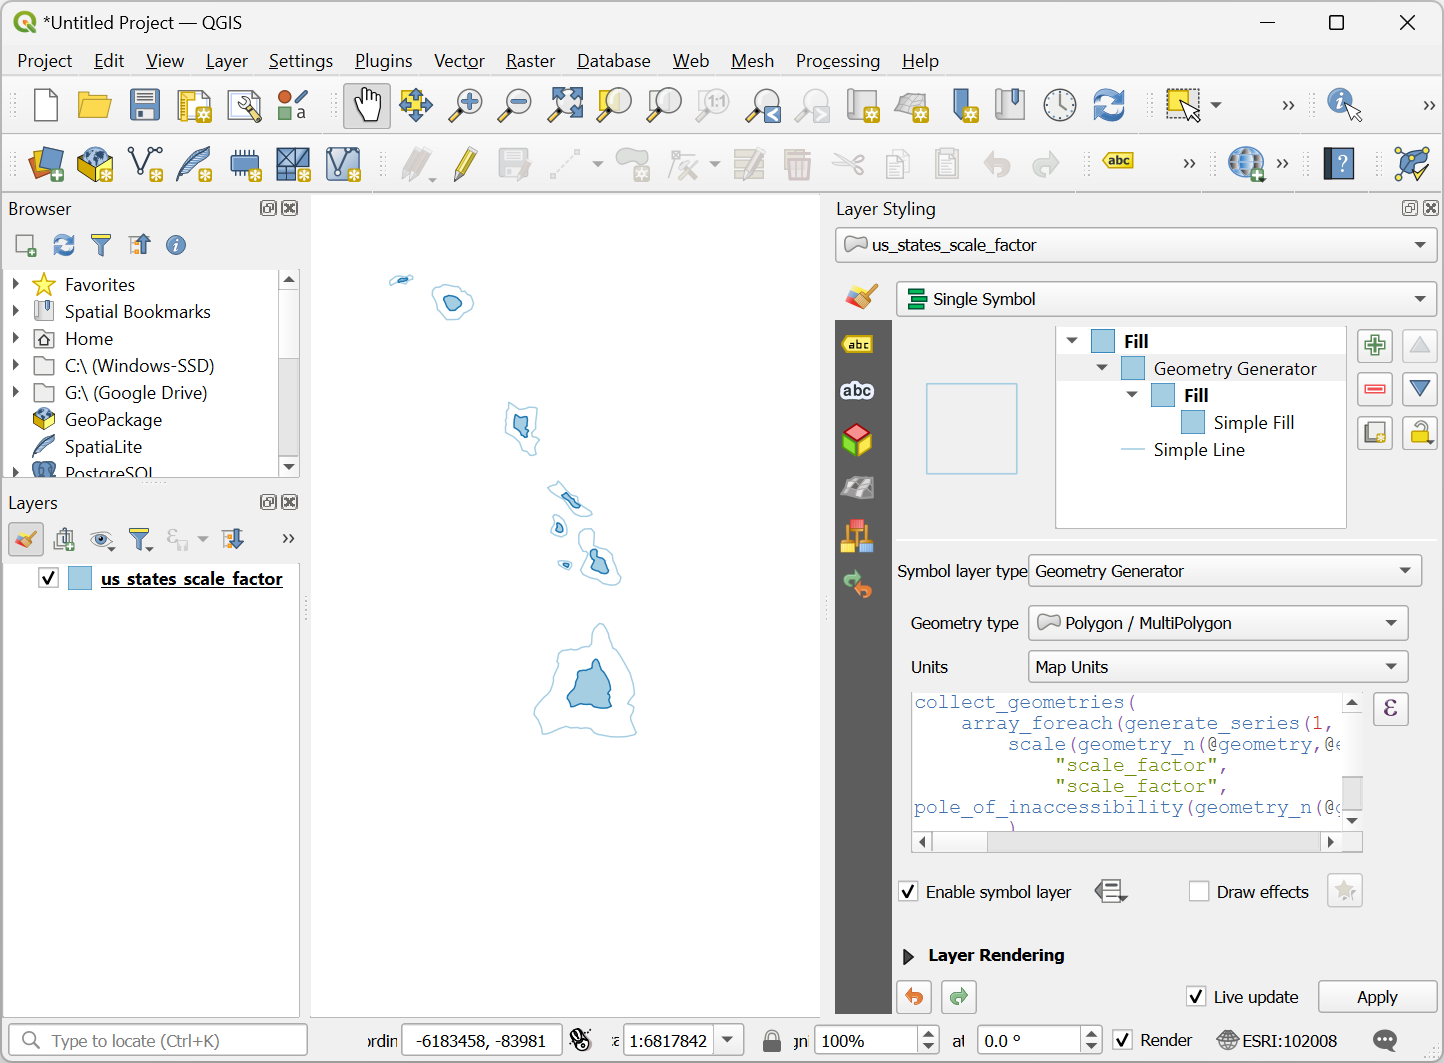
Hier gebruiken we de functie array_foreach() om over elk deel van de geometrie te lopen en er op schaal gebrachte versies van te maken. Tenslotte combineert de functie collect_geometries() elk op schaal gebracht deel naar een enkele geometrie multipolygoon. Werk de expressie bij, zoals hieronder weergegeven, en klik op OK.
collect_geometries(
    array_foreach(generate_series(1, @geometry_part_count),
            scale(geometry_n(@geometry,@element),
                    "scale_factor",
                    "scale_factor",
pole_of_inaccessibility(geometry_n(@geometry,@element), 100)
            )
    )
)
Het resultaat is het veel beter op schaal brengen van meerdelige objecten.
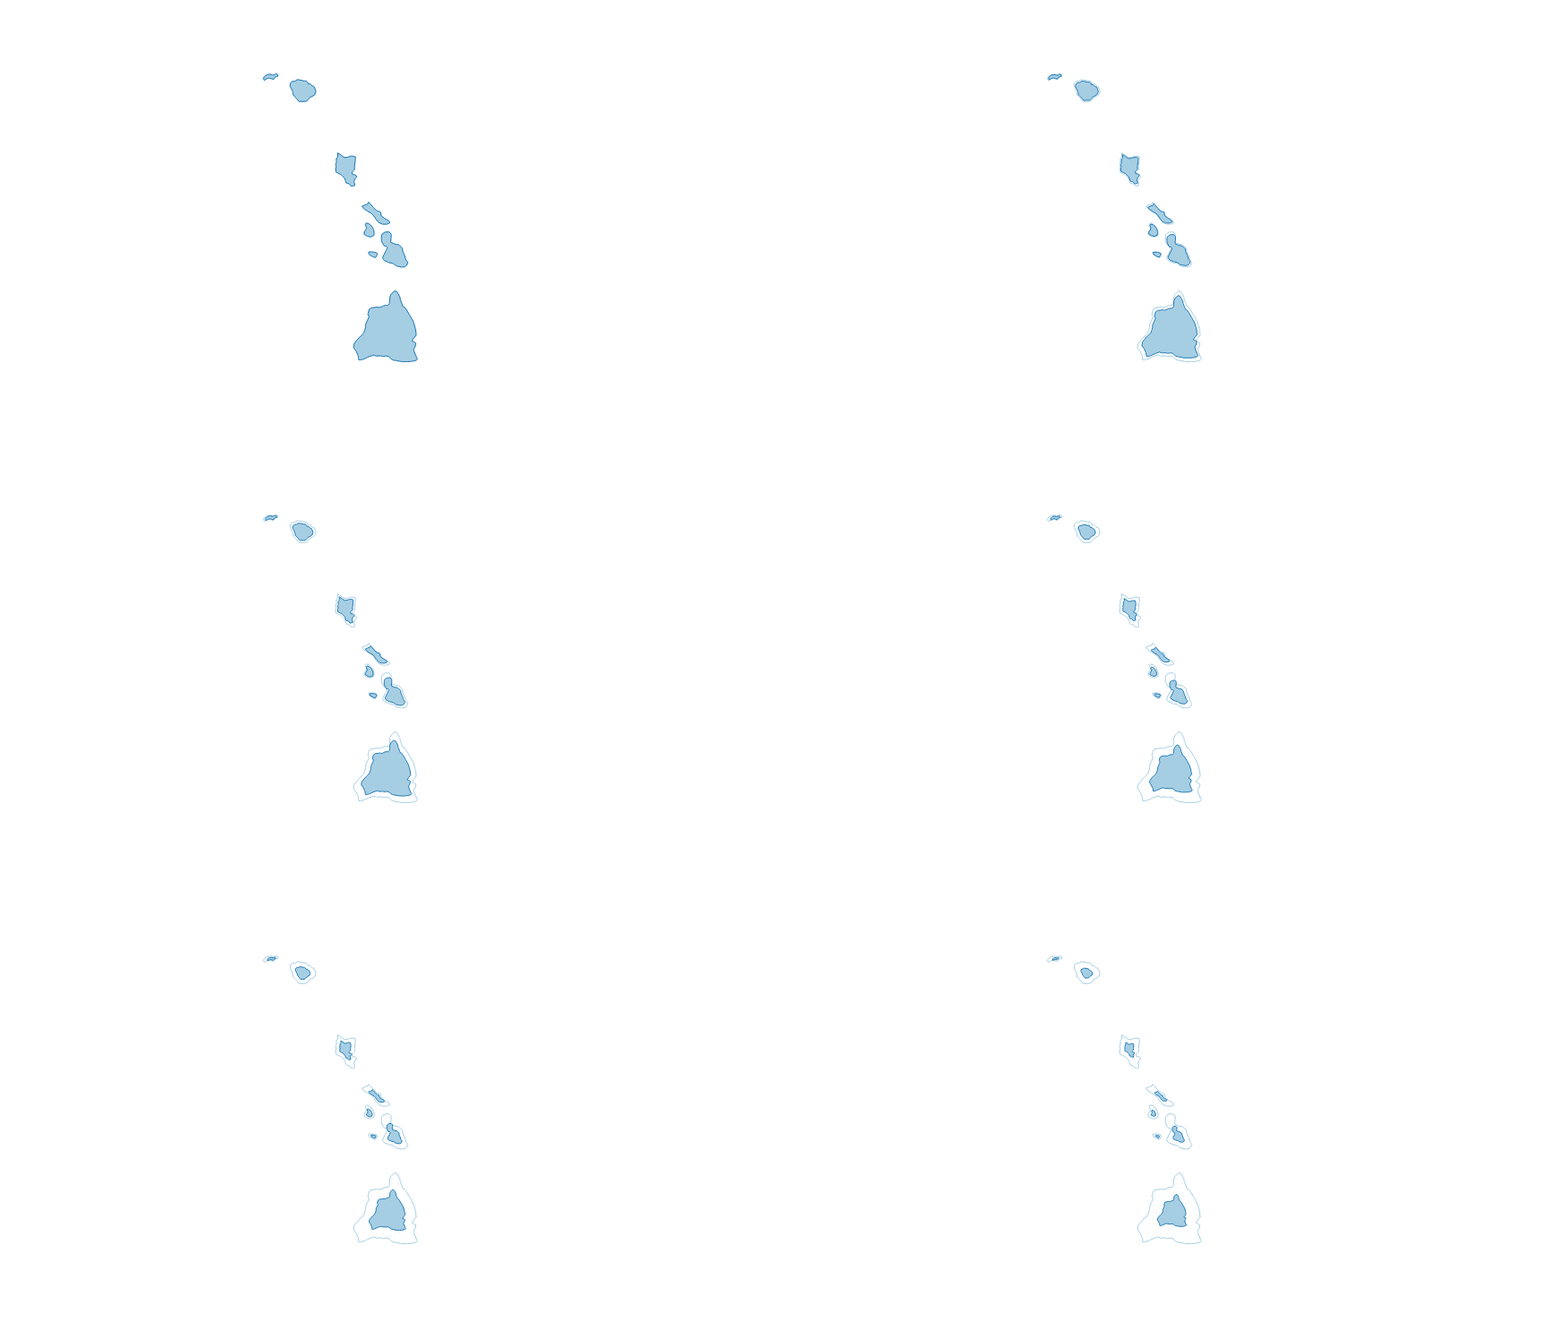
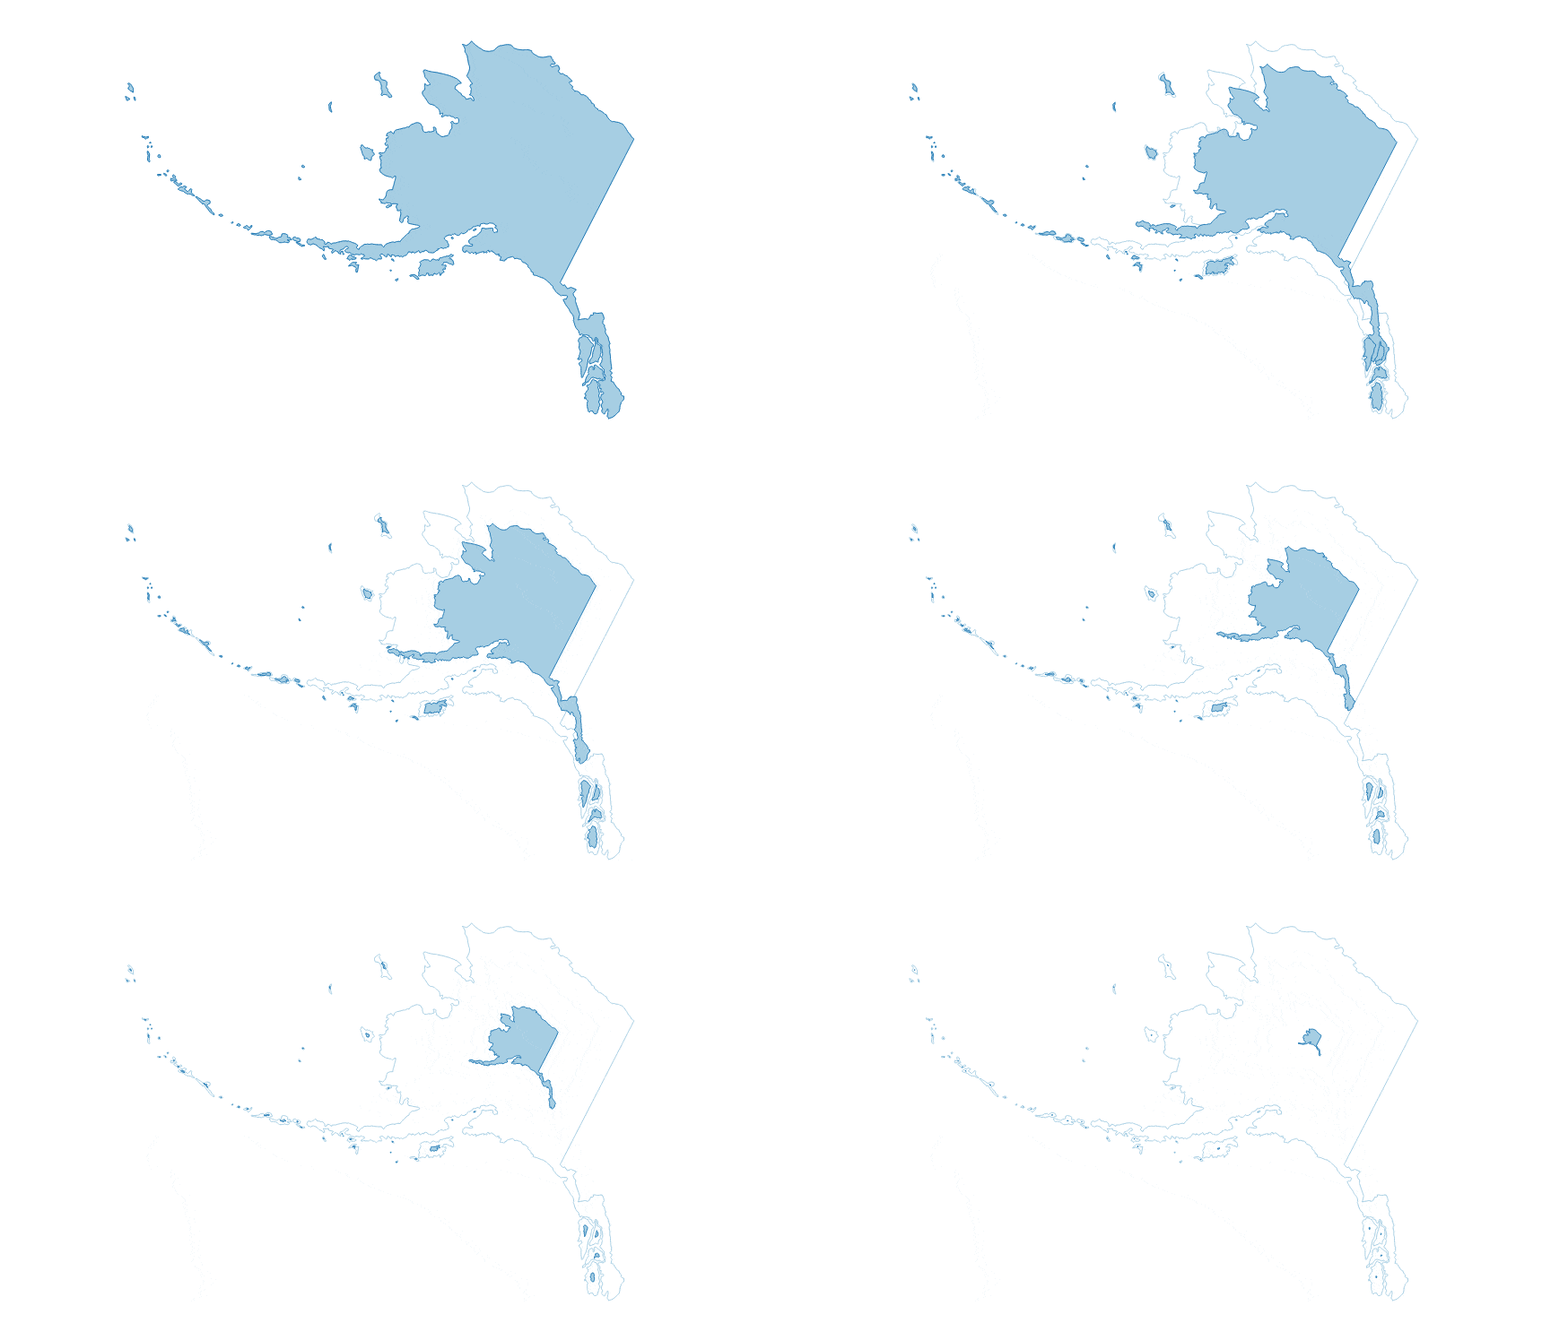
Ons cartogram is voltooid. Deze kaart geeft de concentratie weer van de inwoners voor de oostelijke helft van de VS en een opvallende afwezigheid van inwoners in de staten ten westen van de rivier Mississippi.
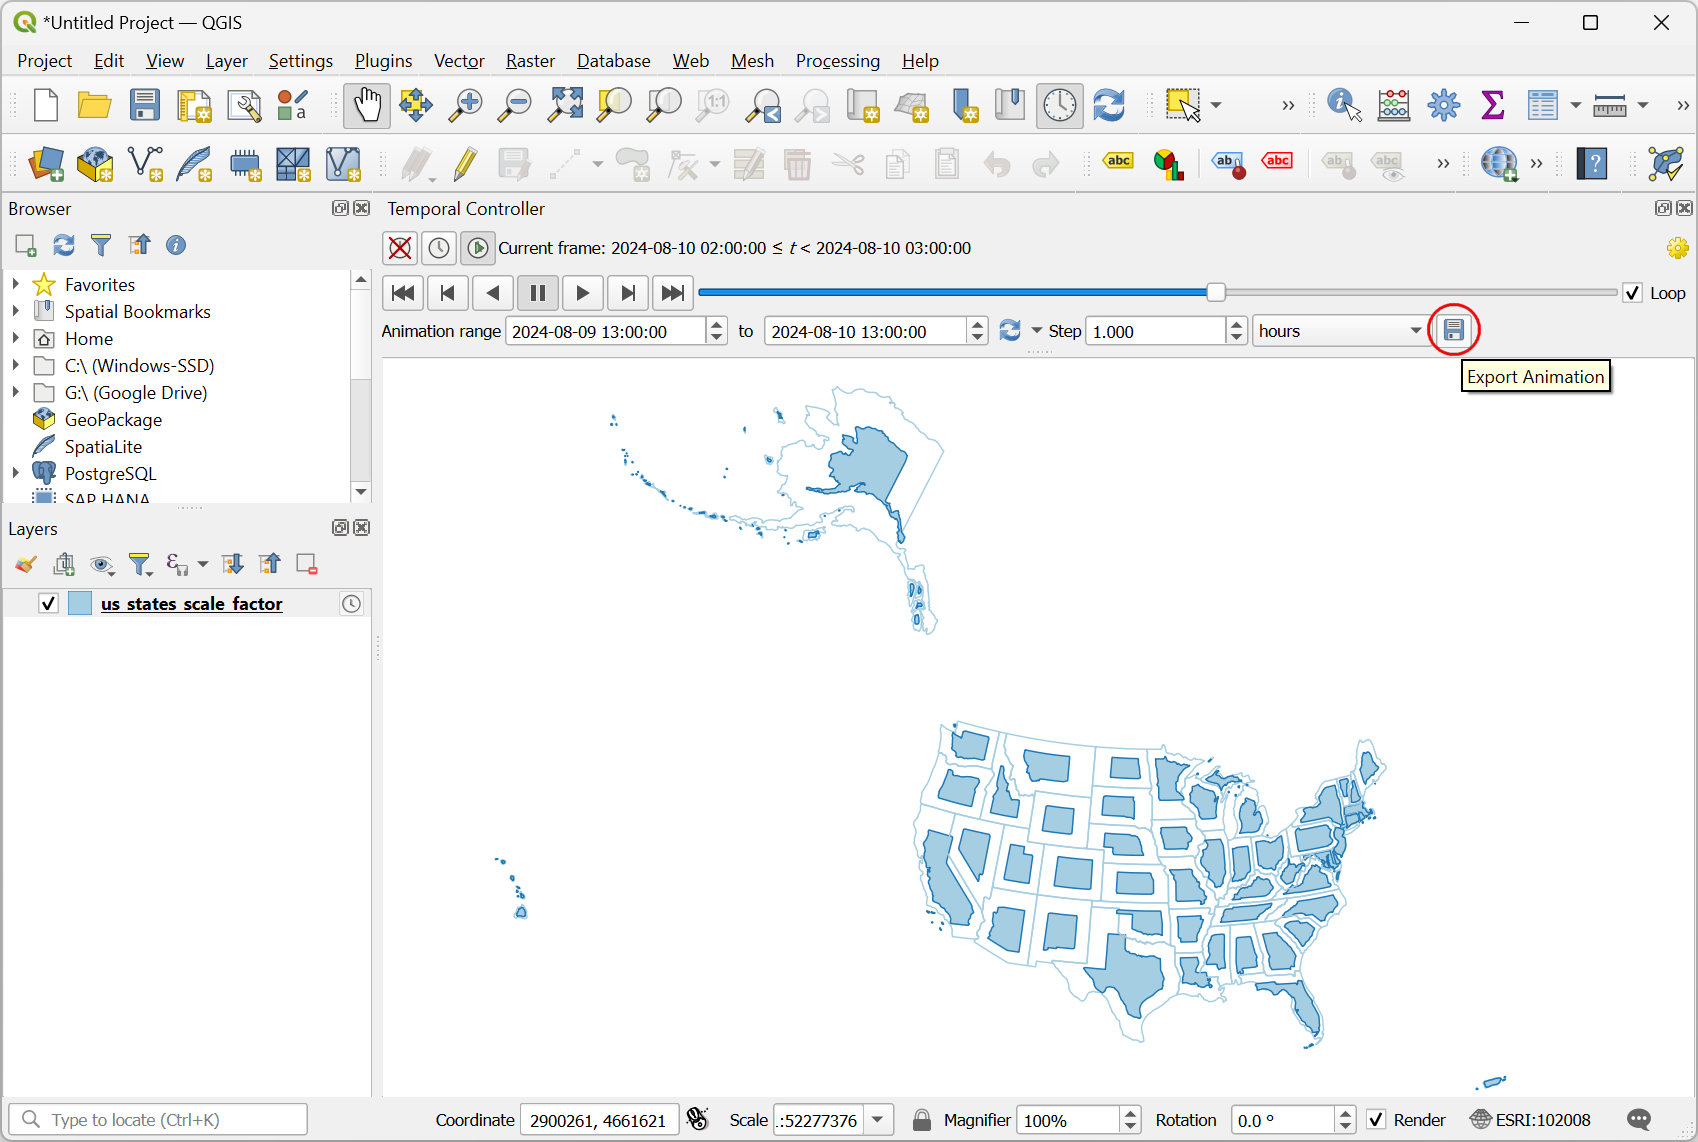
We kunnen een verbeterde visualisatie maken door een animatie die langzaam de originele rendering transformeert naar de uiteindelijke grootte. Klik op de knop Tijdbeheer met het pictogram van een klok op de werkbalk Kaartnavigatie. Selecteer de knop Geanimeerde navigatie voor tijd.
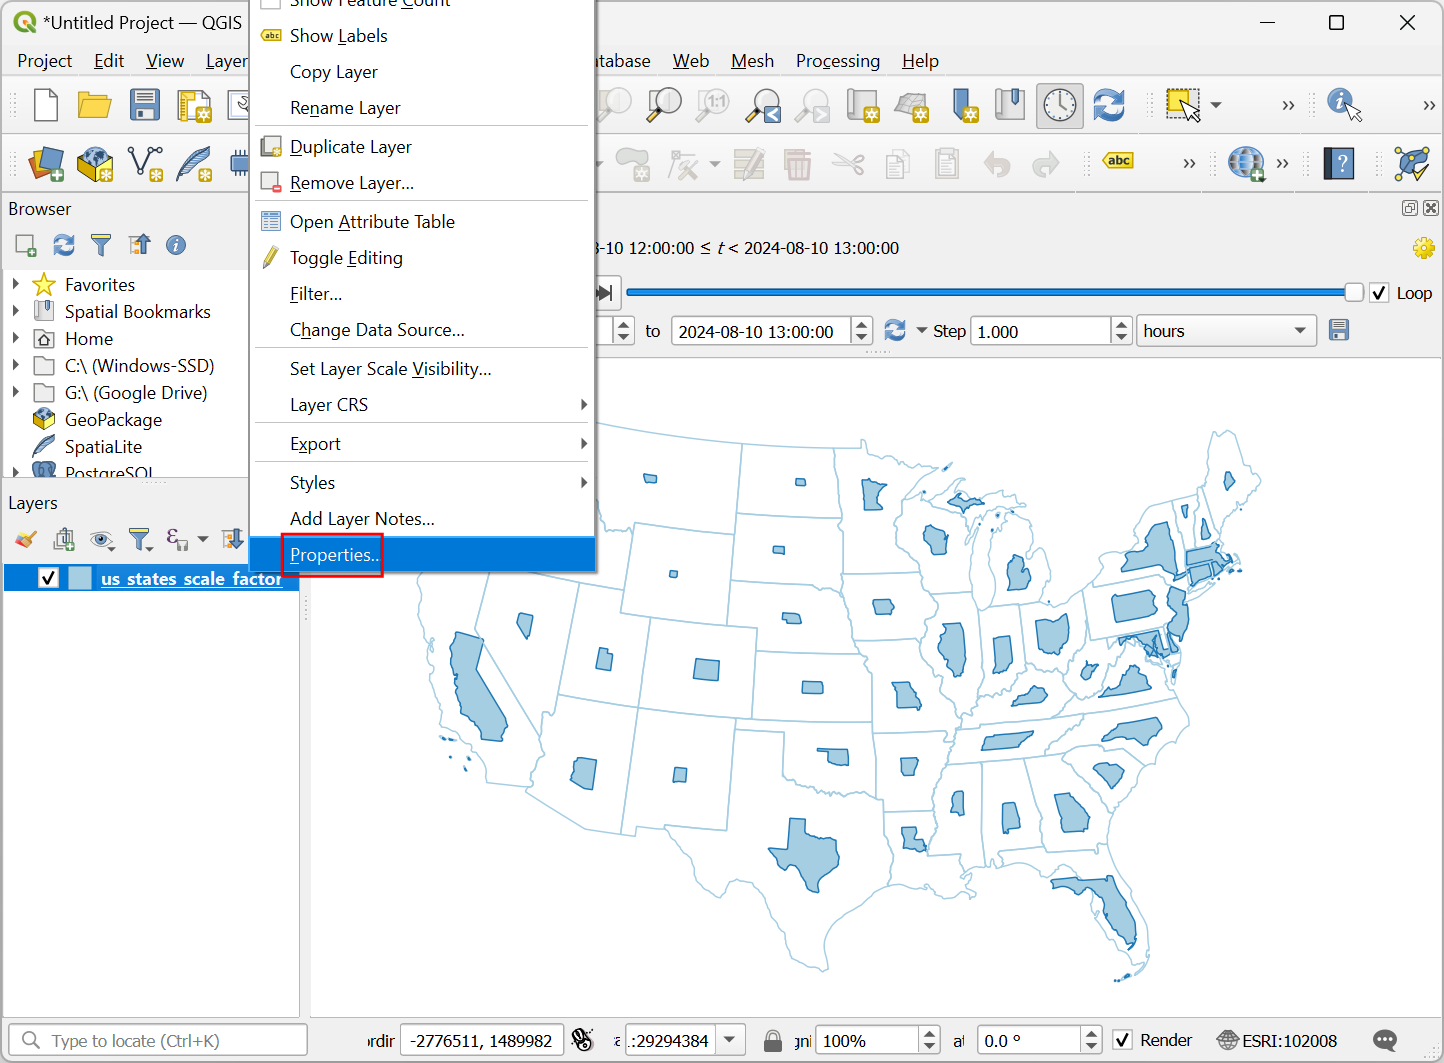
Het standaard Bereik animatie zal worden gevuld met een 24 uursvenster, met een verhoging van 1-uur. Dat is prima voor ons geval voor gebruik, omdat we dan 24 frames voor de animatie krijgen. U kunt dat aanpassen als u een tragere/snellere animatie wilt. Klik met rechts op de laag
us_states_with_populationen selecteer Eigenschappen.
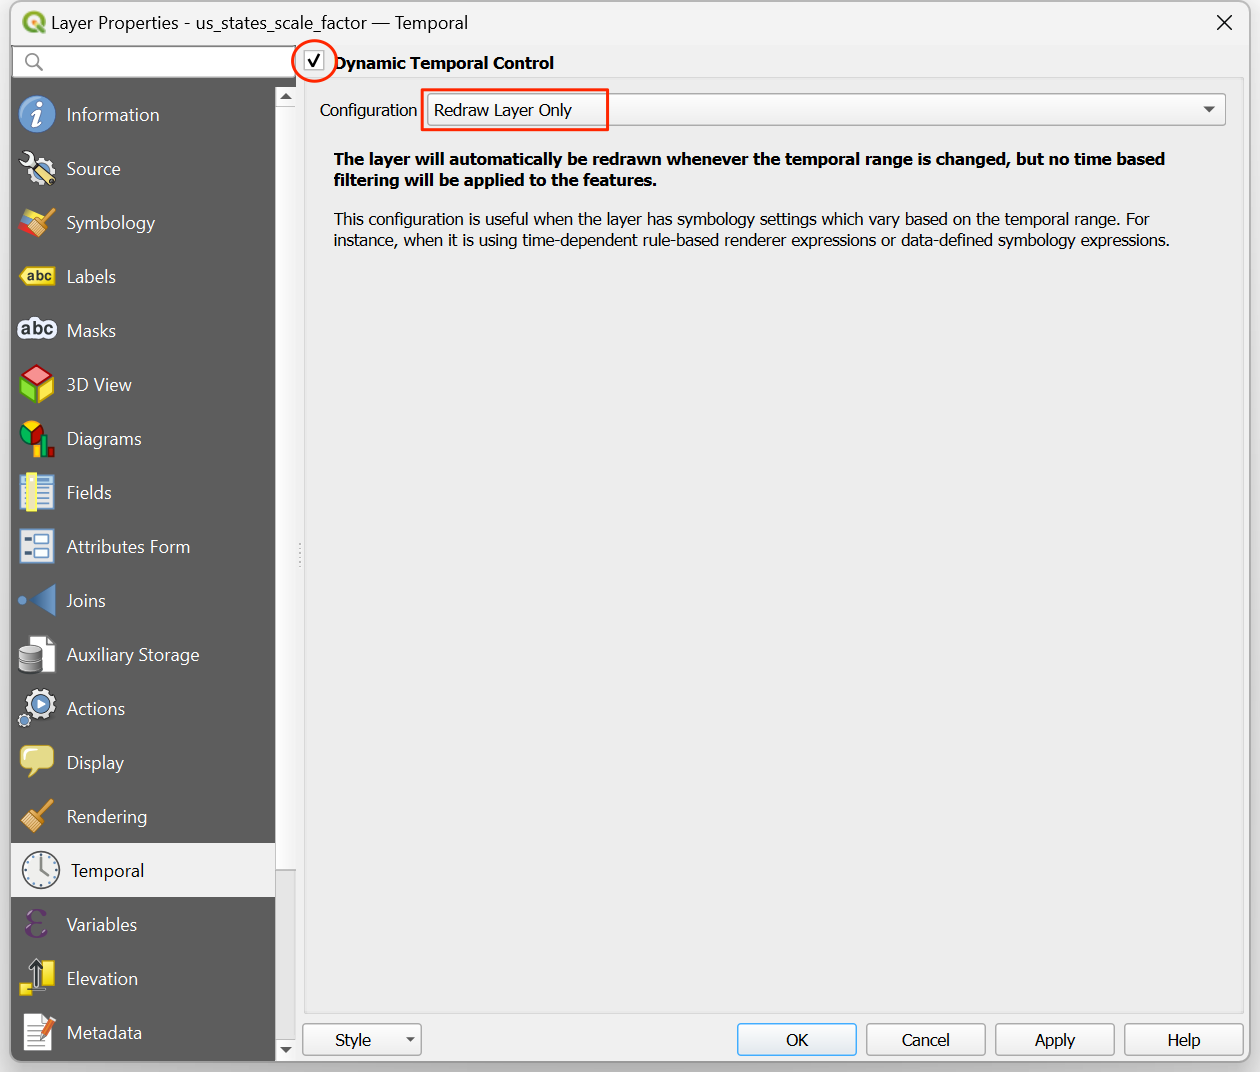
Selecteer de tab Tijdbeheer en schakel Dynamisch Tijdbeheer in. Deze laag zal worden bijgewerkt met een expressie dus dat hoeven we hier niet te configureren. Selecteer eenvoudigweg
Alleen laag opnieuw tekenenzodat de laag wordt vernieuwd na elke tijdstap en gerenderd met de bijgewerkte waarden uit de expressie.
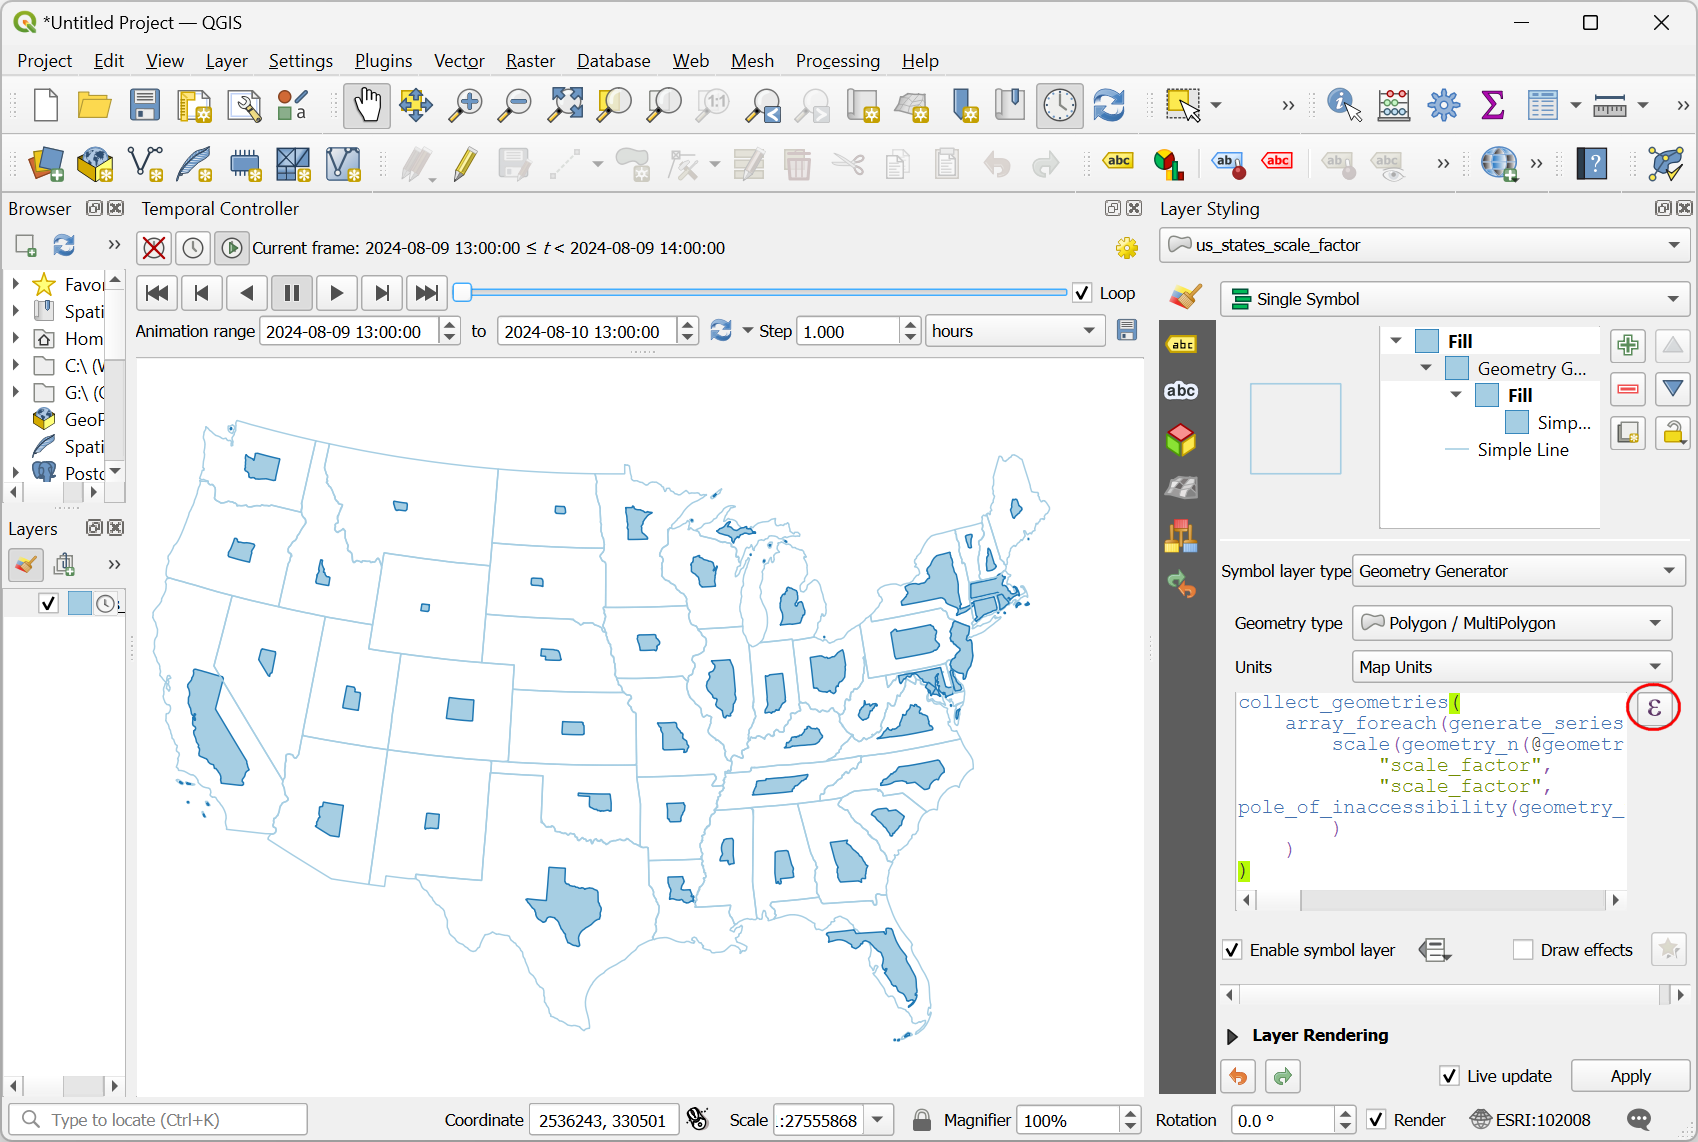
Laten we onze expressie van de Geometrie-generator bijwerken om de tijdstappen voor de animatie te gebruiken en gradueel de geometrie op schaal te brengen. Klik op de knop Paneel Laag opmaken openen in het paneel Lagen. Selecteer Geometrie-generator, gevolgd door de knop Expressiebouwer.
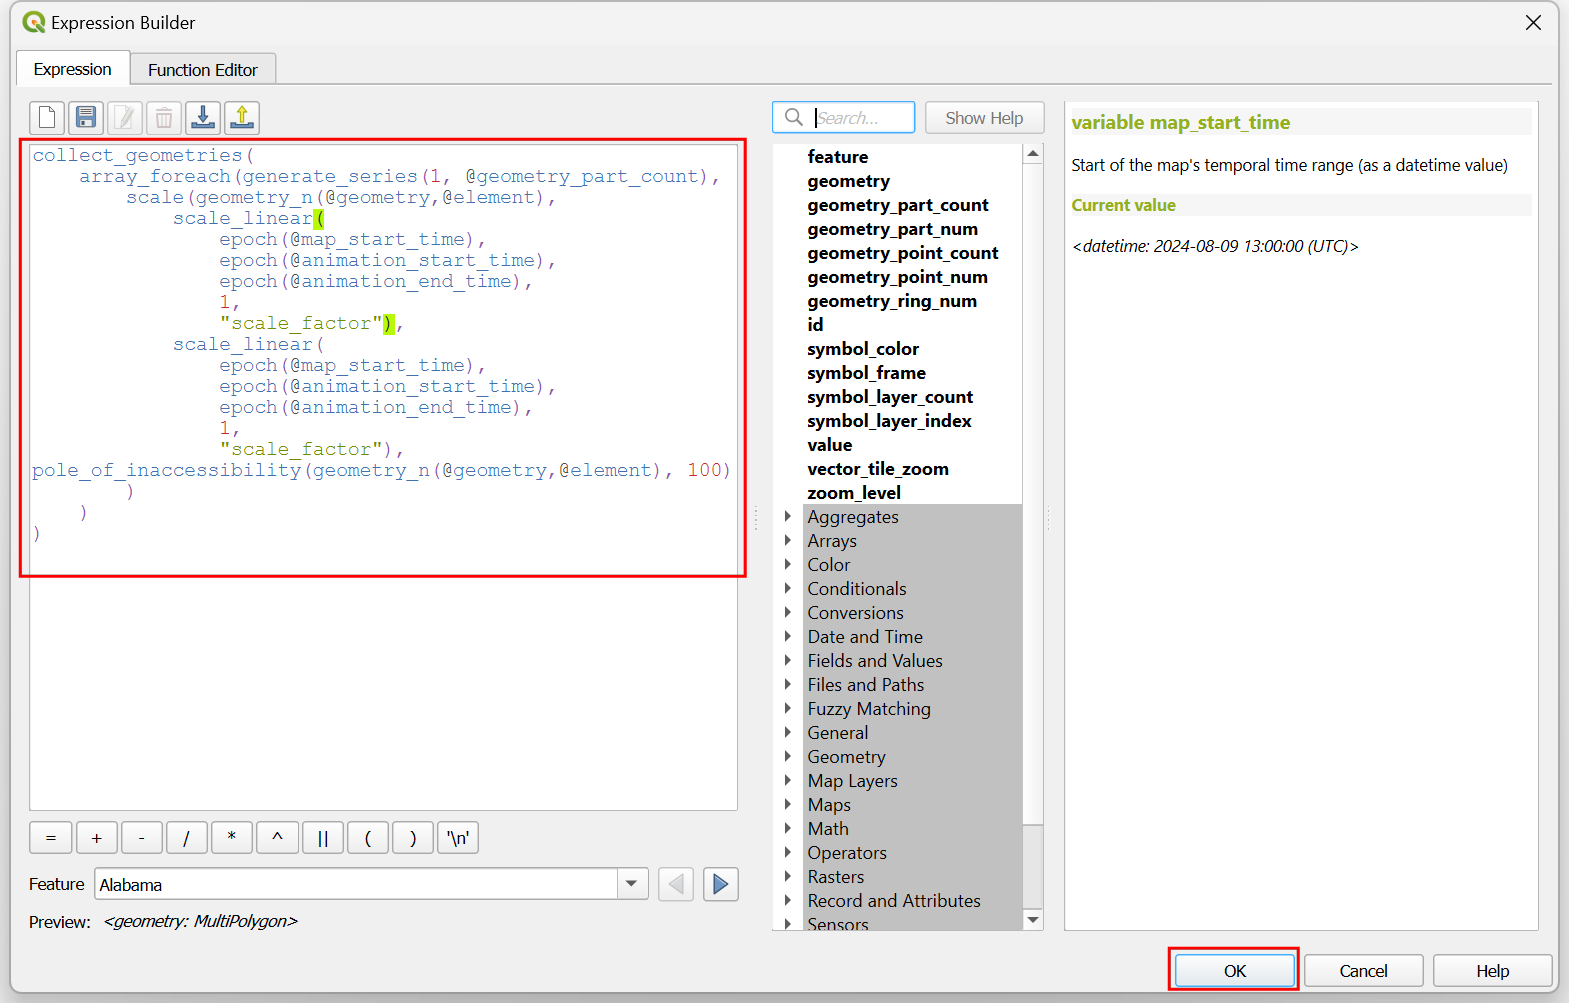
Hier willen we beginnen met een schaalfactor van 1 en eindigen met de uiteindelijke schaalfactor van voor het object in het veld
scale_factor. We gebruiken de functie scale_linear() die de tijd van de huidige tijdstap neemt en berekent de schaalfactor met de begin- en eindtijden. Werk de expressie, bij zoals hieronder weergegeven, en klik op OK.
collect_geometries(
    array_foreach(generate_series(1, @geometry_part_count),
            scale(geometry_n(@geometry,@element),
                    scale_linear(
                            epoch(@map_start_time),
                            epoch(@animation_start_time),
                            epoch(@animation_end_time),
                            1,
                            "scale_factor"),
                    scale_linear(
                            epoch(@map_start_time),
                            epoch(@animation_start_time),
                            epoch(@animation_end_time),
                            1,
                            "scale_factor"),
pole_of_inaccessibility(geometry_n(@geometry,@element), 100)
            )
    )
)
Terug in het paneel Tijdbeheer, klik op de knop Afspelen om de animatie te bekijken. U zou de vorm van elke polygoon geleidelijk moeten zien worden geschaald na elk frame.
Als u tevreden bent met de configuratie, kunnen we de animatie exporteren. Klik op de knop Animatie exporteren.
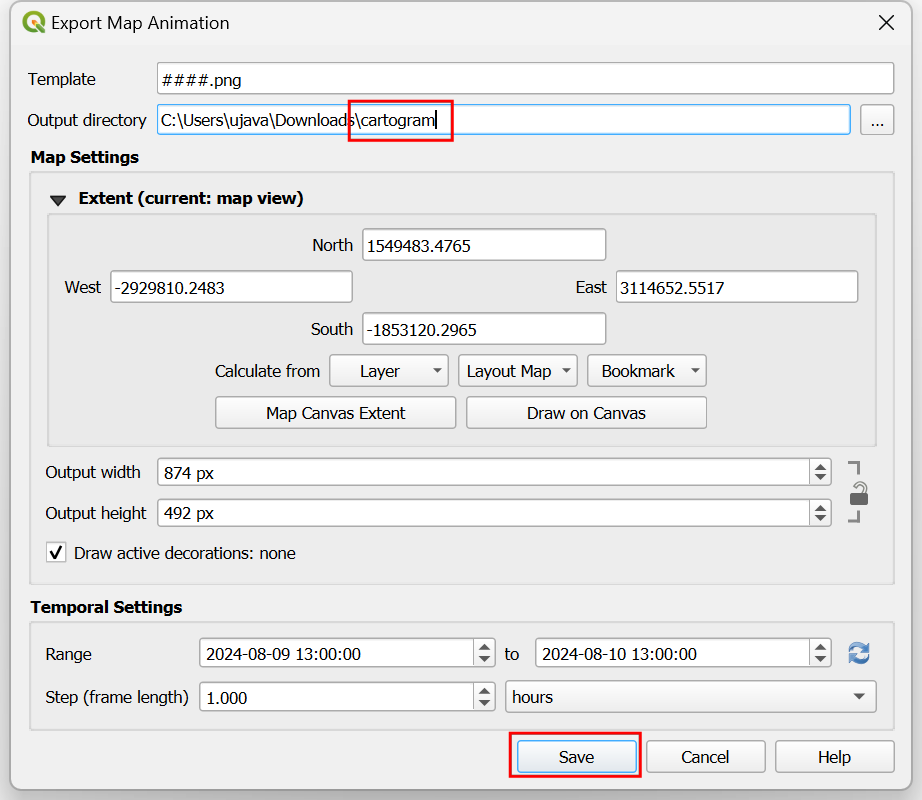
In het dialoogvenster Animatie van kaart exporteren, klik op … naast Map voor uitvoer en blader naar een map op uw computer. Behoud alle andere opties op hun standaard waarden en klik op Opslaan.
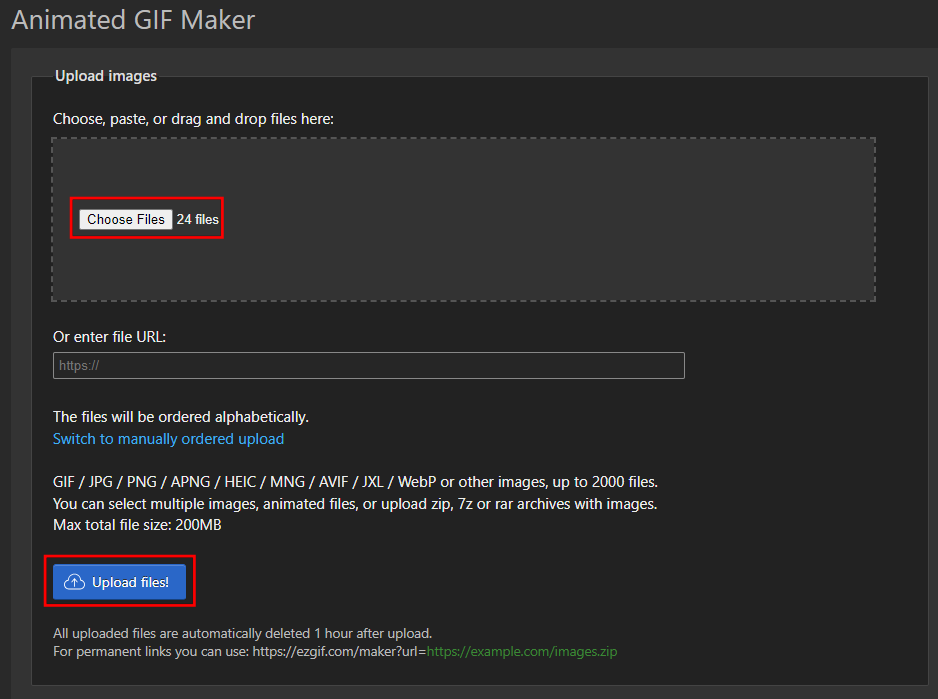
De individuele frames van de animatie zullen als afbeeldingen worden geëxporteerd. We kunnen een video of geanimeerde GIF maken met deze frames. Ik raad aan om de website ezgif.com te gebruiken die u in staat stelt gemakkelijk GIF’s te maken uit individuele afbeeldingen. Bezoek Ezgif Animated GIF Maker. Blader naar de geëxporteerde frames van de animatie en klik op Upload files!.
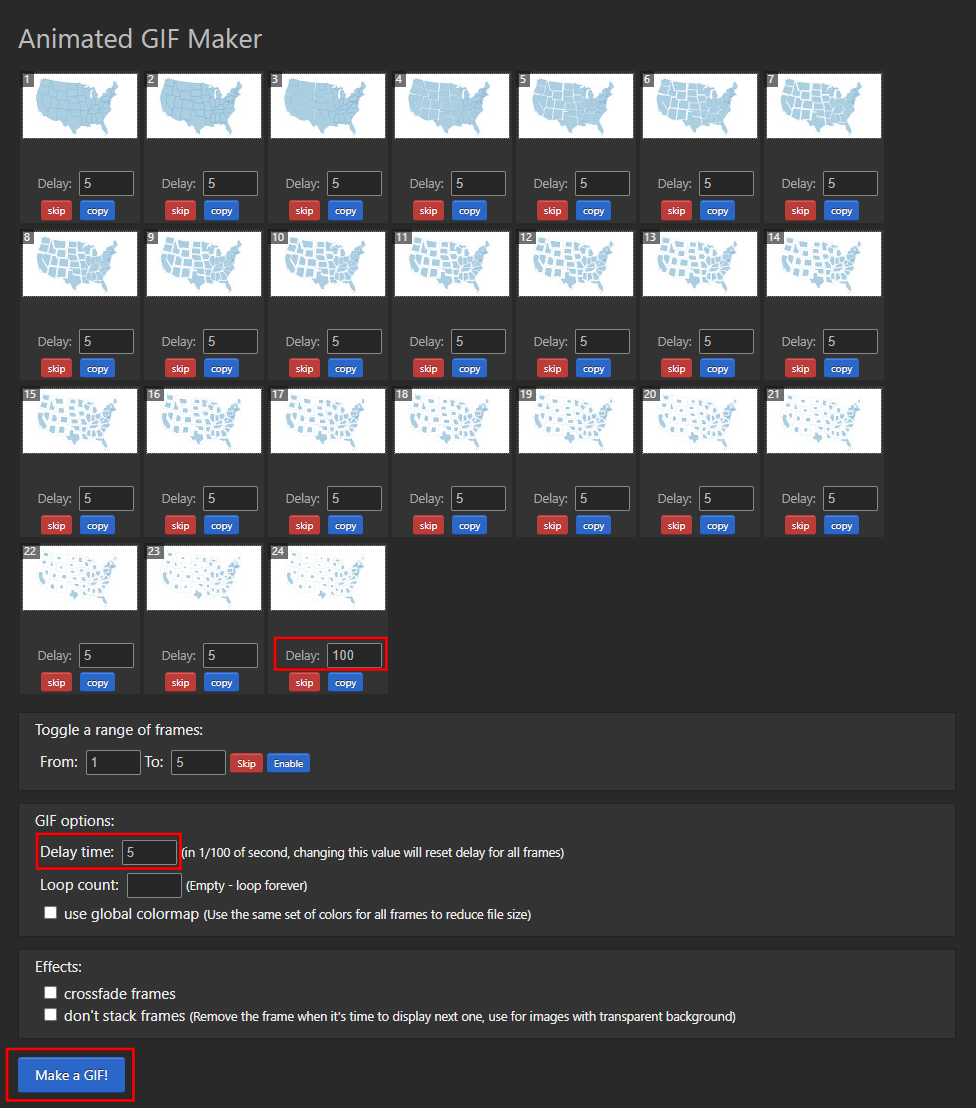
Configureer de opties voor de GIF door Delay time in te stellen op
5. Selecteer het effect crossfade frames en stel Fader delay en Fader count in op2. Klik op Make a GIF!/
Klik op de knop save om de animatie als een GIF-bestand te downloaden.
 Ujaval Gandhi





If you want to give feedback or share your experience with this tutorial, please comment below. (requires GitHub account)