 Ujaval Gandhi
Automating Map Creation with Print Layout Atlas (QGIS3)
If your organization publishes printed or online maps, you often would need to
create many maps with the same template - usually one for each administrative
unit or a region of interest. Creating these maps manually can take a long time
and if you want to update these on a regular basis, it can turn into a chore.
QGIS has a tool called Atlas that can help you create a map template and
easily publish a large number of maps for different geographic regions. If you
are not familiar with the basics of Print Layout, please go through the
製作地圖 tutorial.
內容說明
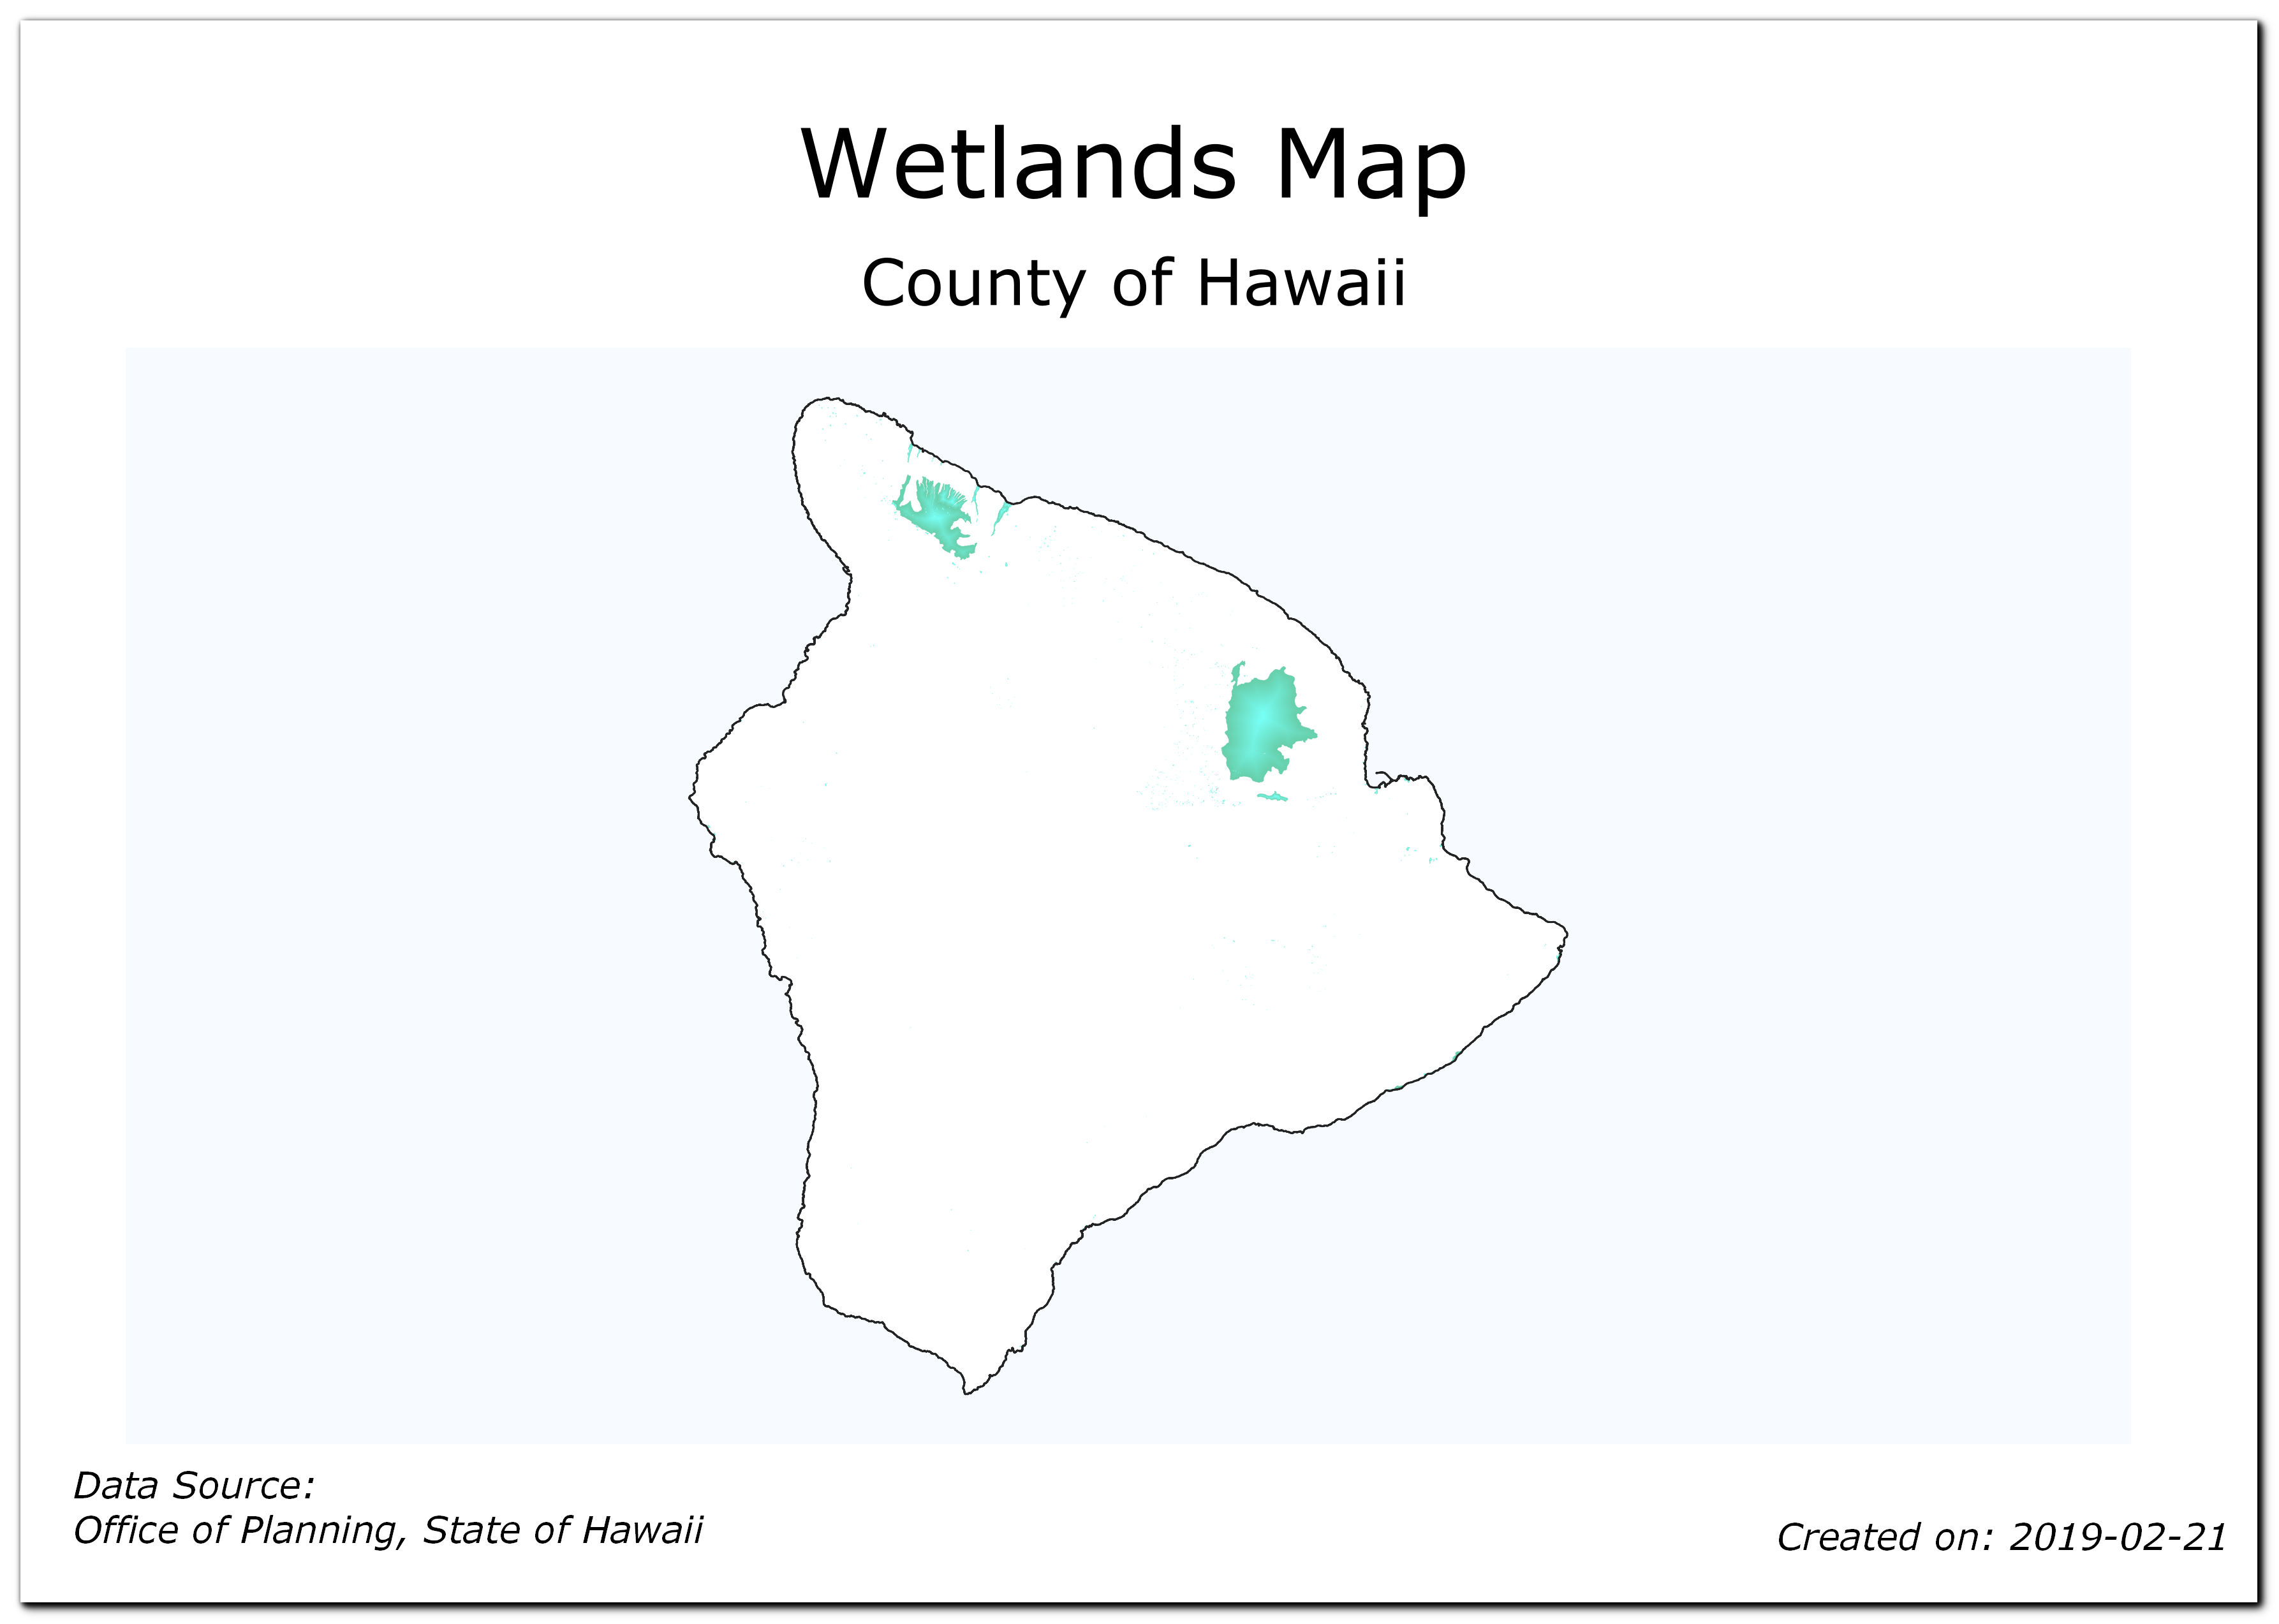
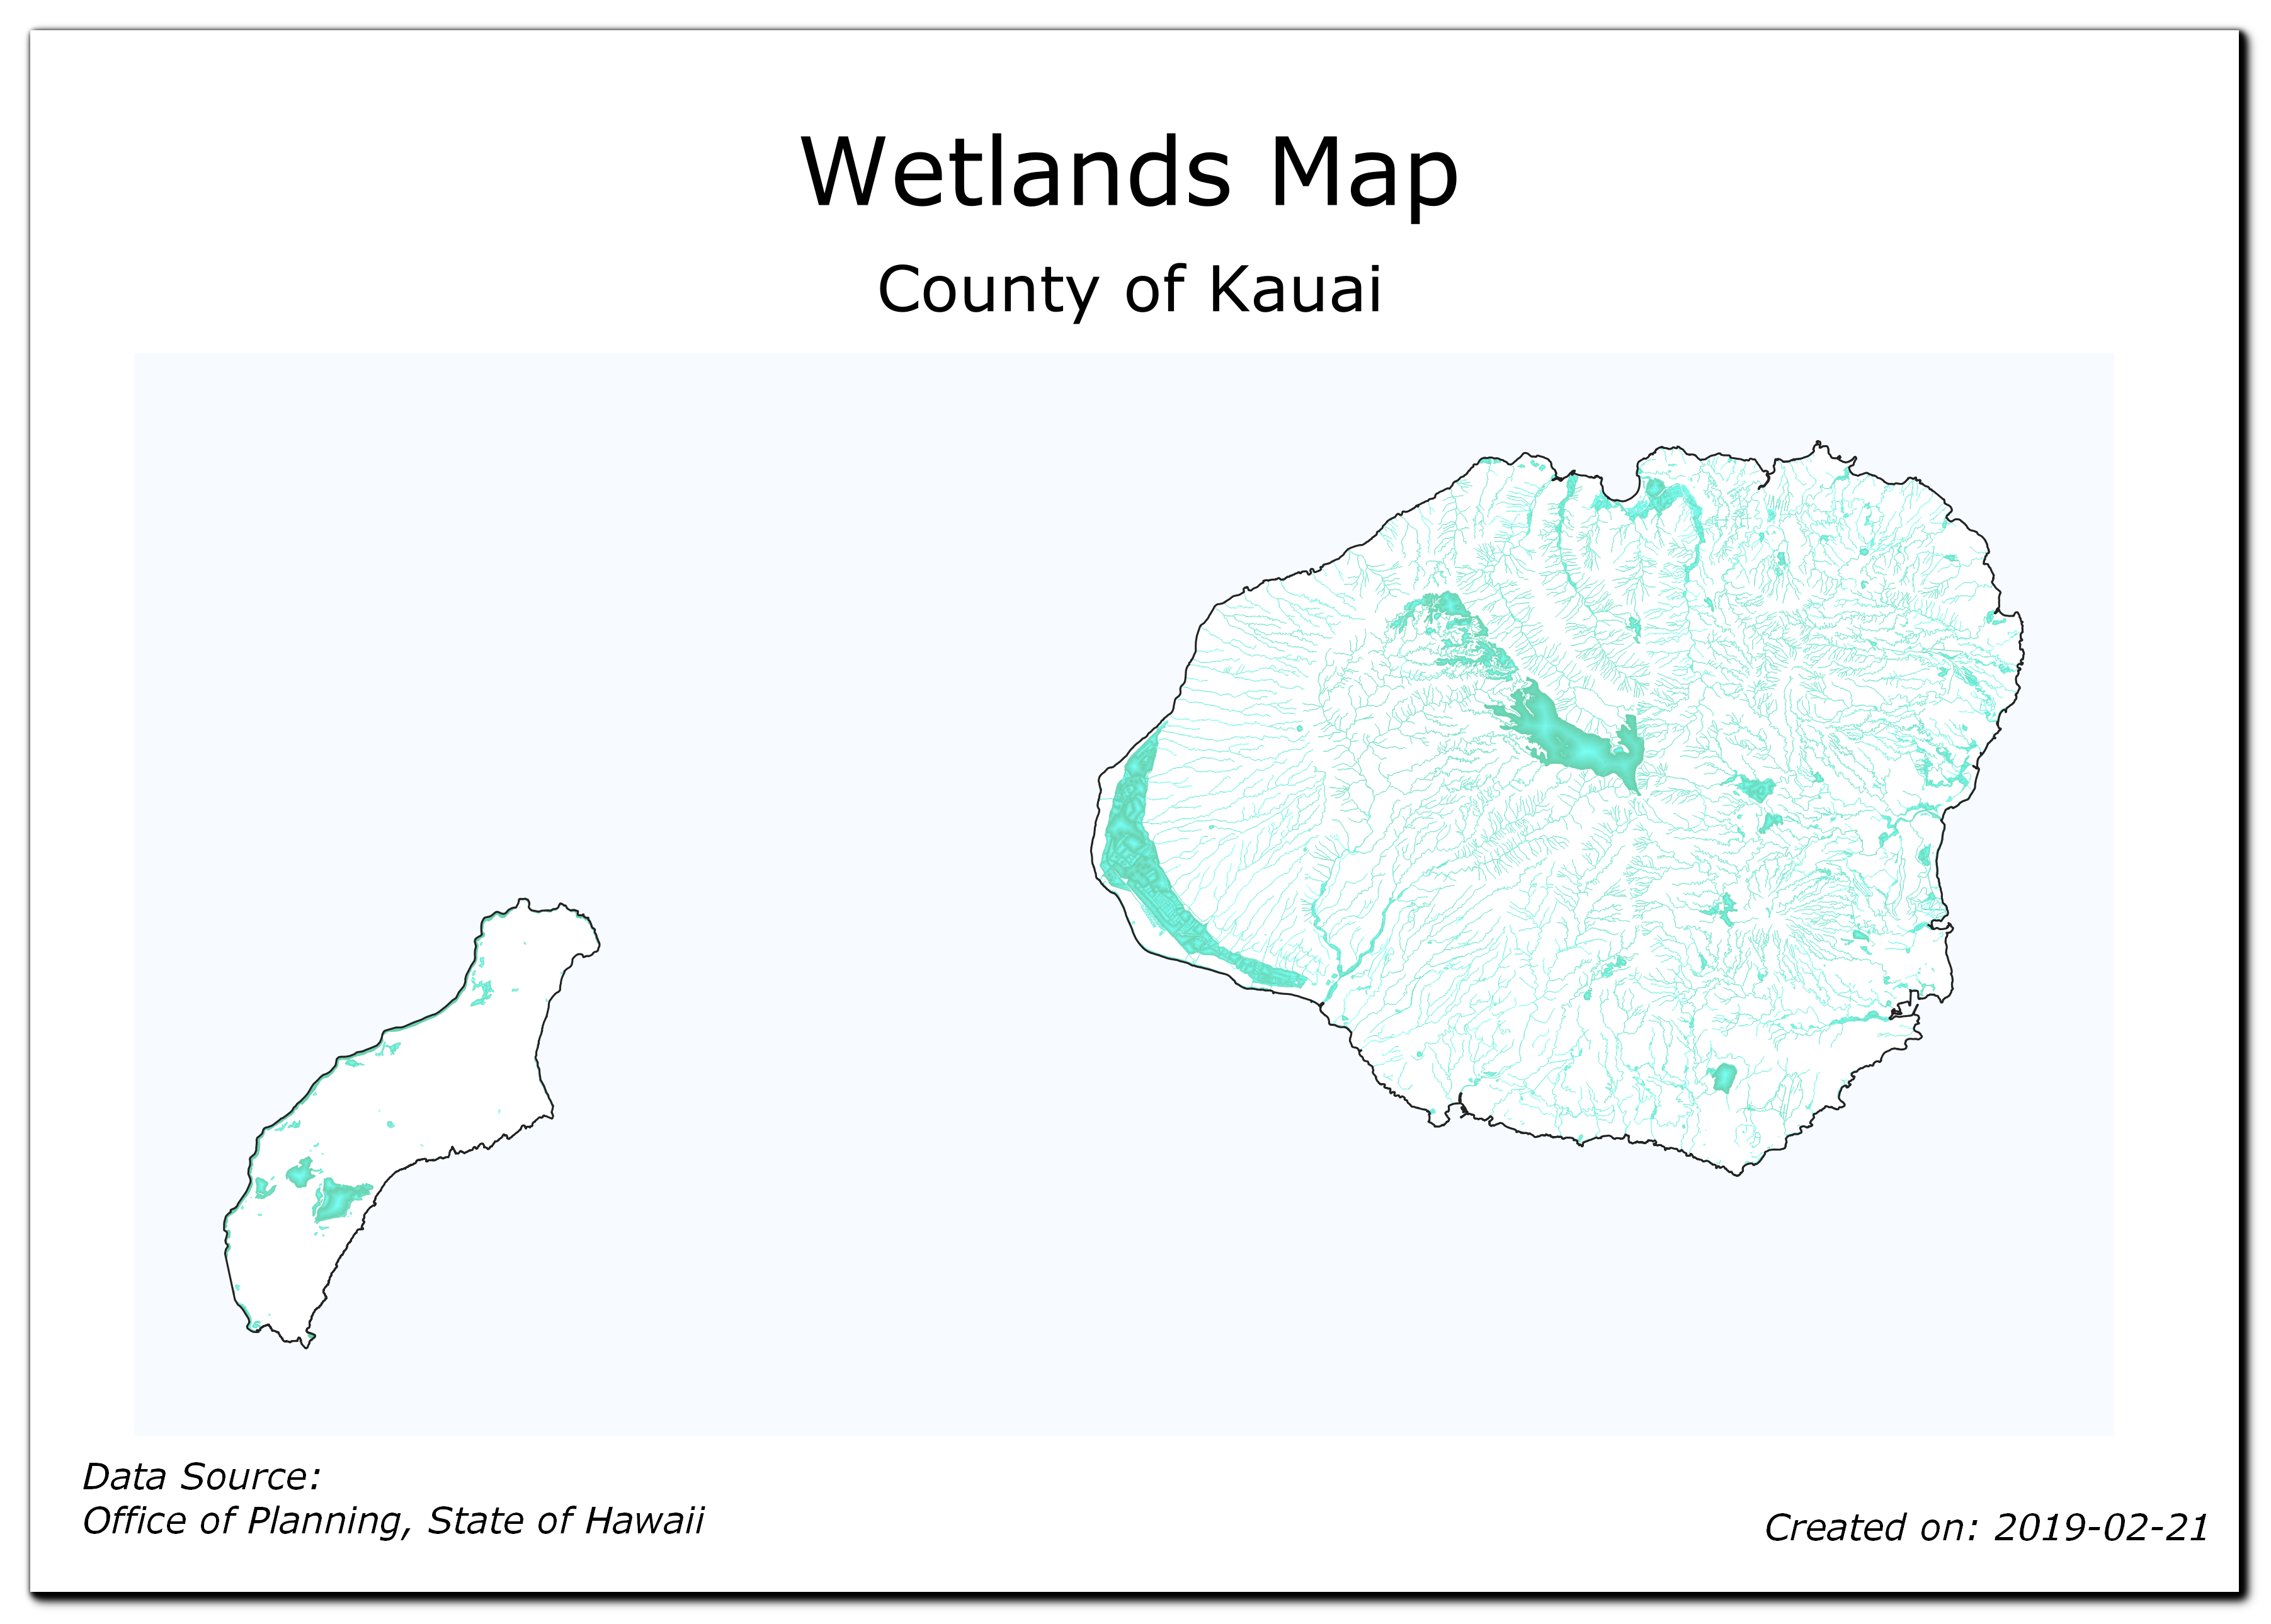
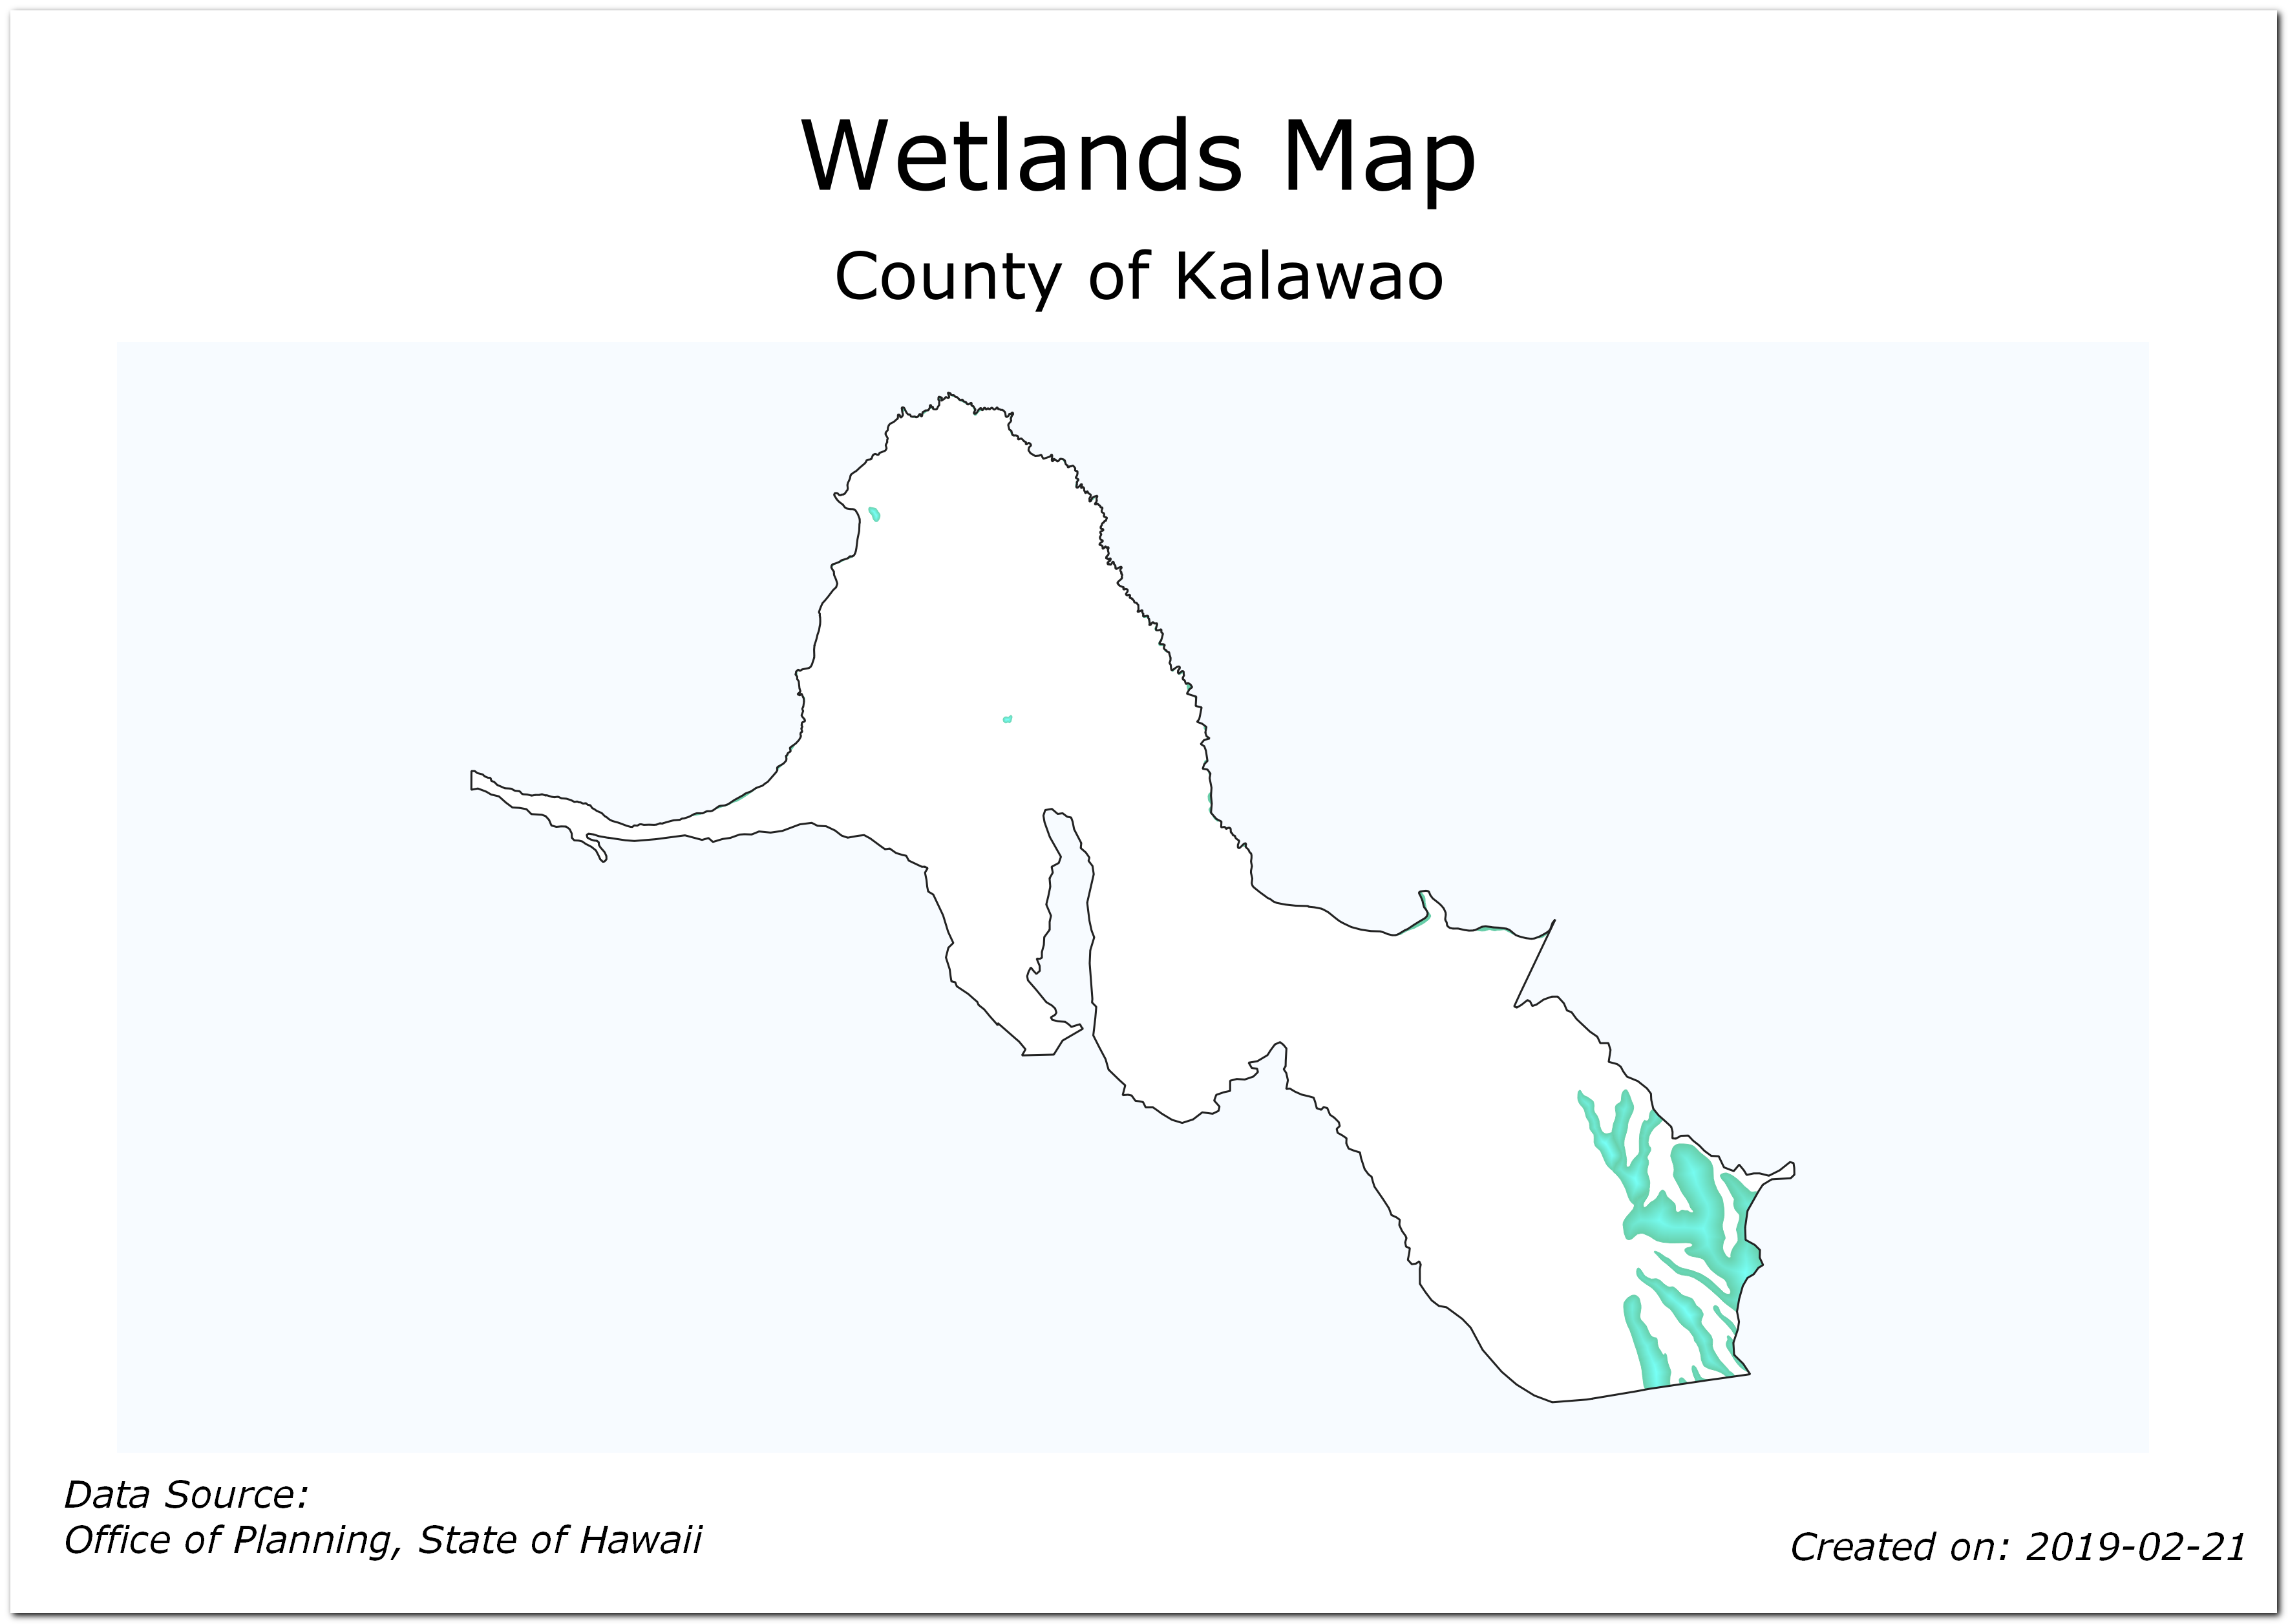
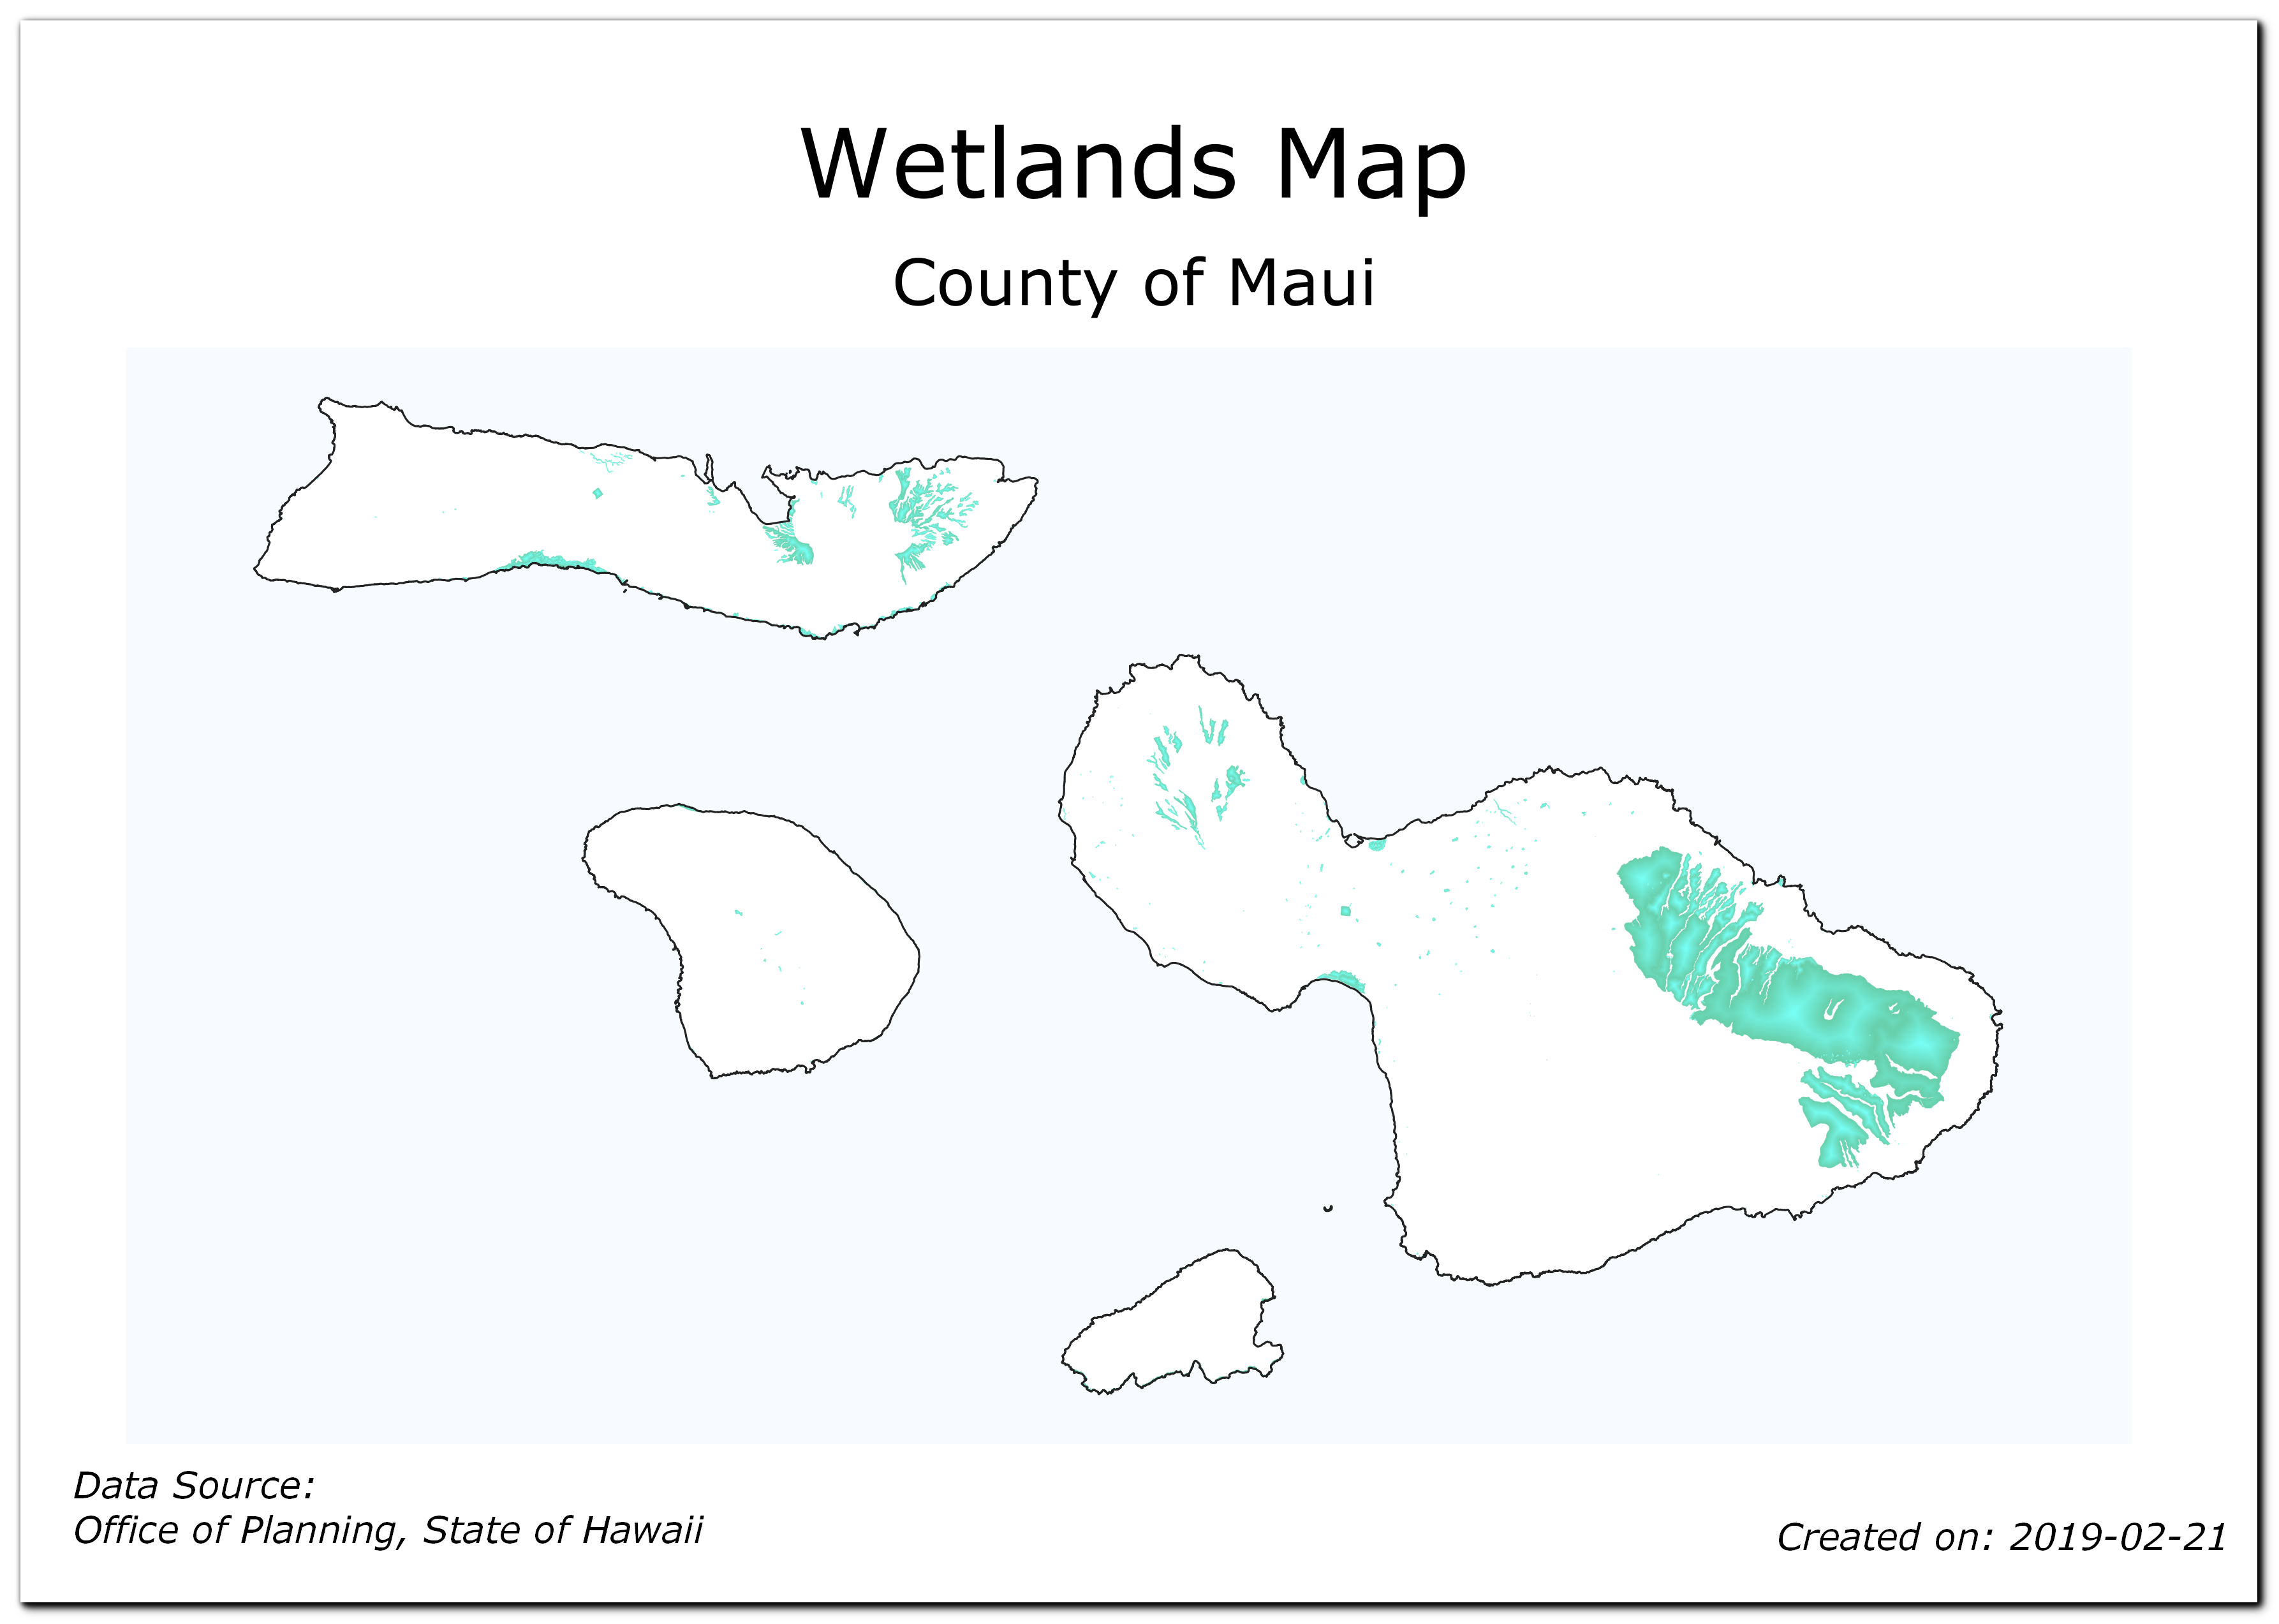
本教學將示範如何為夏威夷州的每個縣製作濕地地圖。
你還會學到這些
使用
反轉多邊形樣式設定多邊形外側的區域樣式Write an expression in the
Rule Basedstyle renderer to show only the current feature in Atlas.Write an expression to create dynamic labels in Print Layout.
Using
Shapeburst fillstyle renderer to create a dual-tone polygon fill.
取得資料
本章中我們使用的是夏威夷州 Office of Planning提供的 GIS 資料圖層
下載隸屬於生物與生態類別的濕地圖層
下載隸屬於文化與人口統計類別的 2010 郡縣邊界 圖層
為了方便起見,你也可以直接用下面的連結下載這兩份資料集:
資料來源 [HAWAII]
操作流程
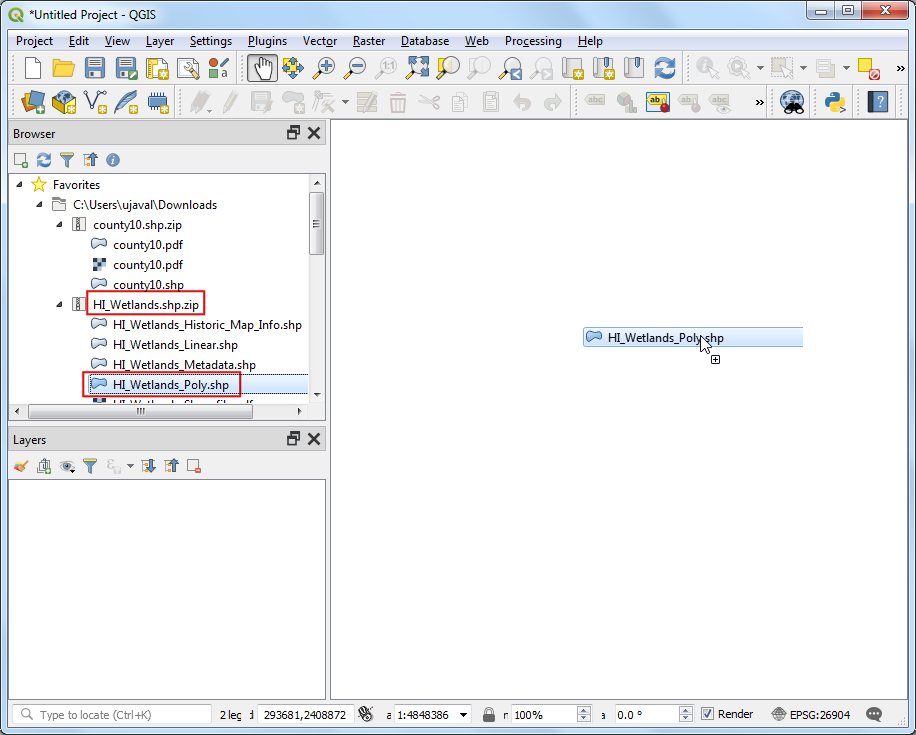
Locate the
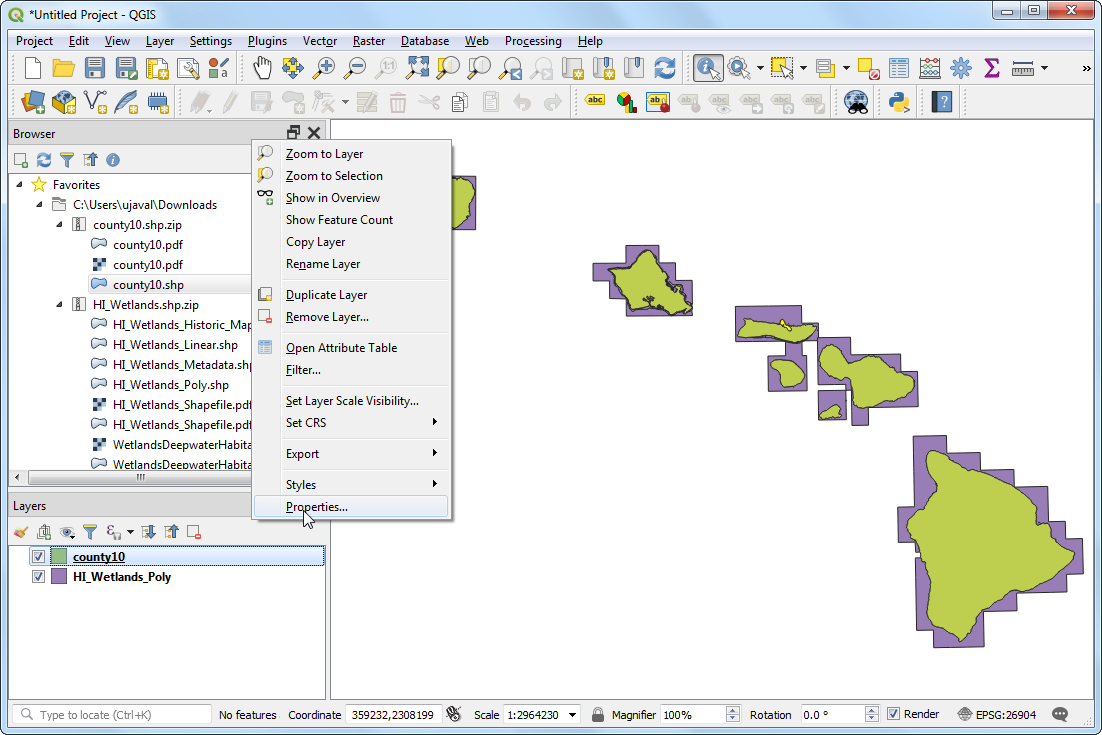
HI_Wetlands.shp.zipfile in the QGIS Browser and expand it. Select theHI_Wetlands_Poly.shpfile and drag it to the canvas. This layer contains polygons representing wetlands in the entire state of Hawaii.
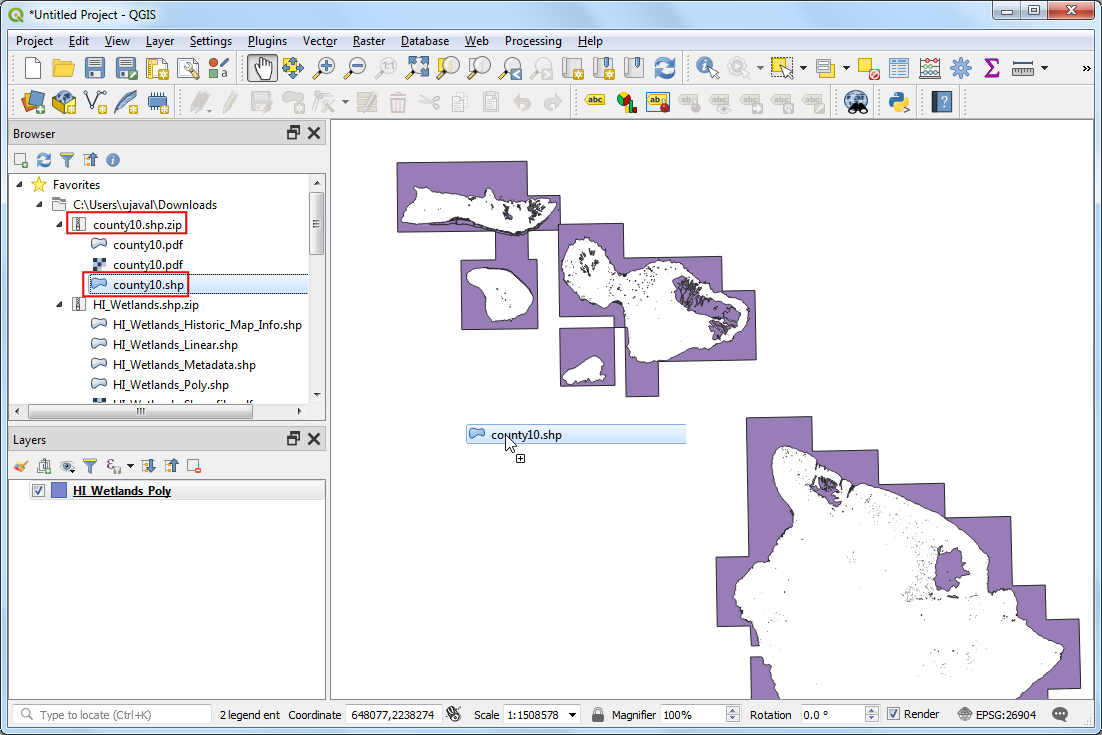
Since we want to make separate wetlands map for each county in the state, we will need the county boundaries layer. Browse to the
county10.shp.zipfile and expand it. Select thecounty10.shpfile and drag it to the canvas.
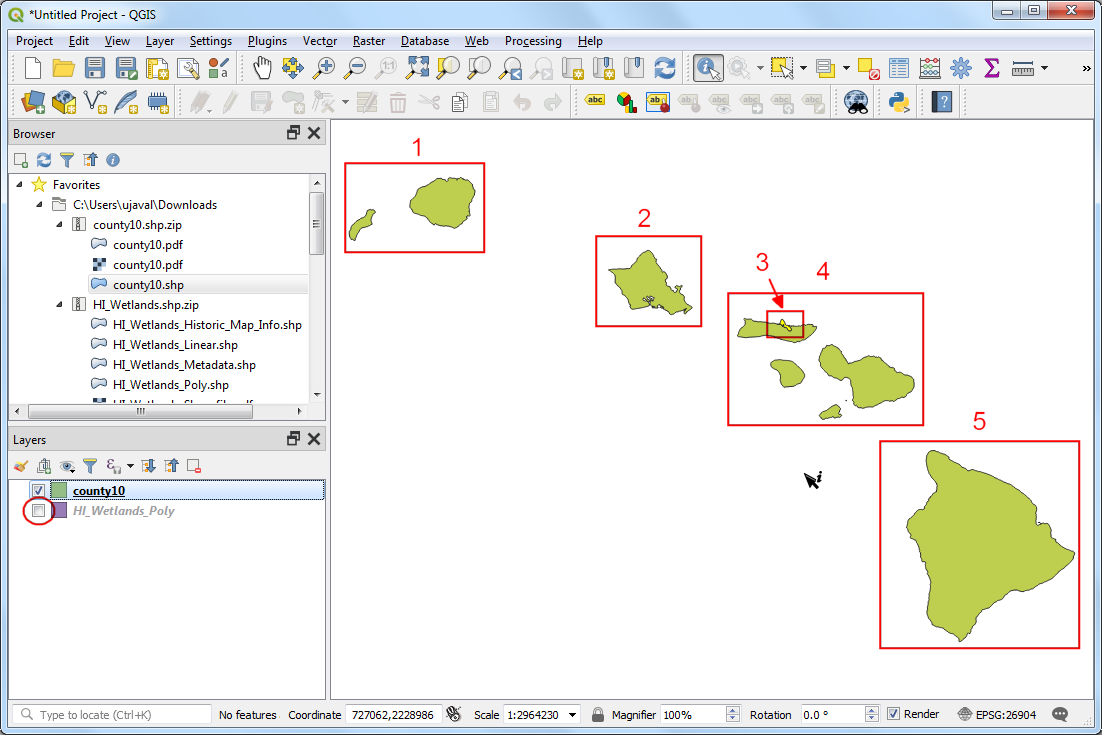
Turn off the visibility of the
HI_Wetlands_Polylayer temporarily. You will see the polygons from thecounty10layer clearly now. There are 5 features contained in this layer, with each feature having 1 or more polygons associated with it. The features represent 5 counties. We will use this layer as the coverage layer and configure QGIS to create 5 separate maps - one for each feature - automatically.
Turn on the visibility of the
HI_Wetlands_Polylayer. Go to .
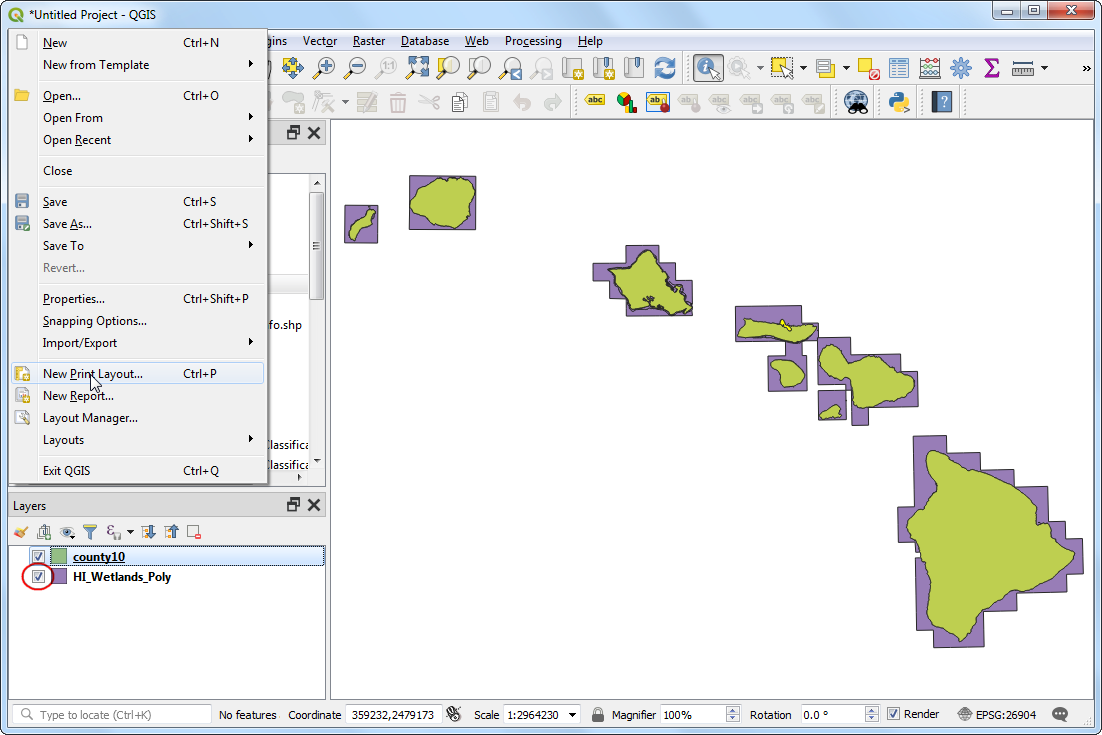
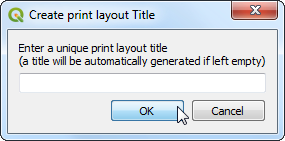
Leave the print layout title empty and click OK.
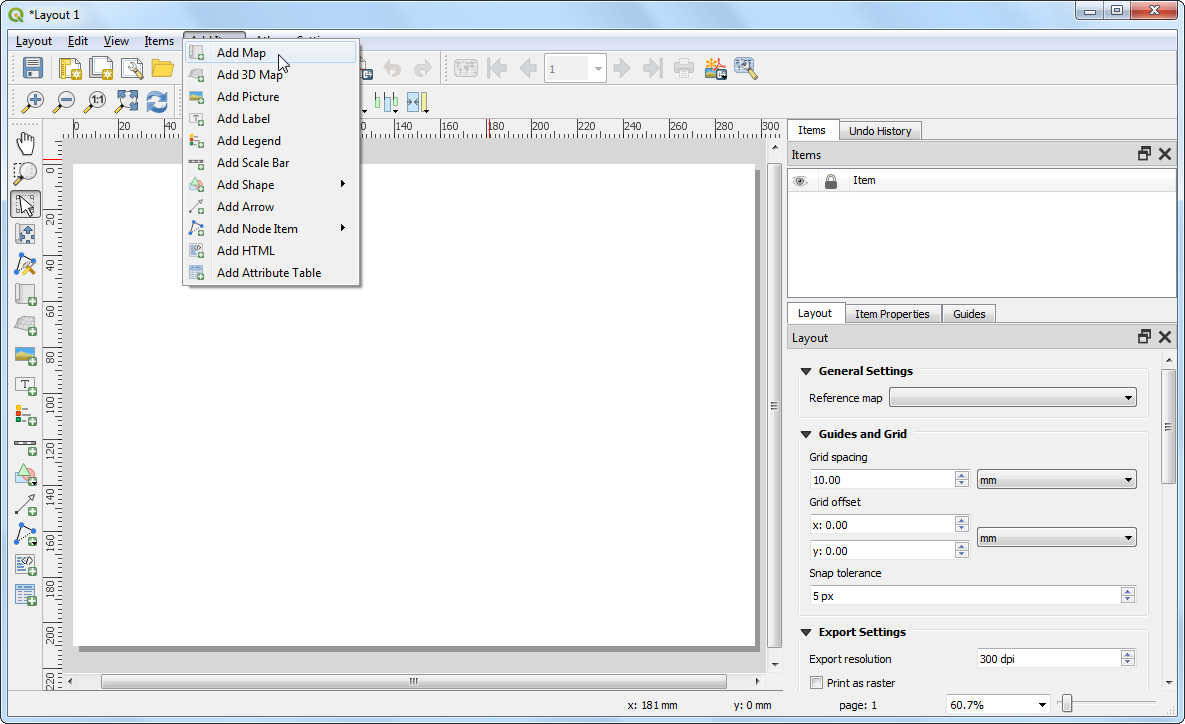
In the Print Layout window, go to .
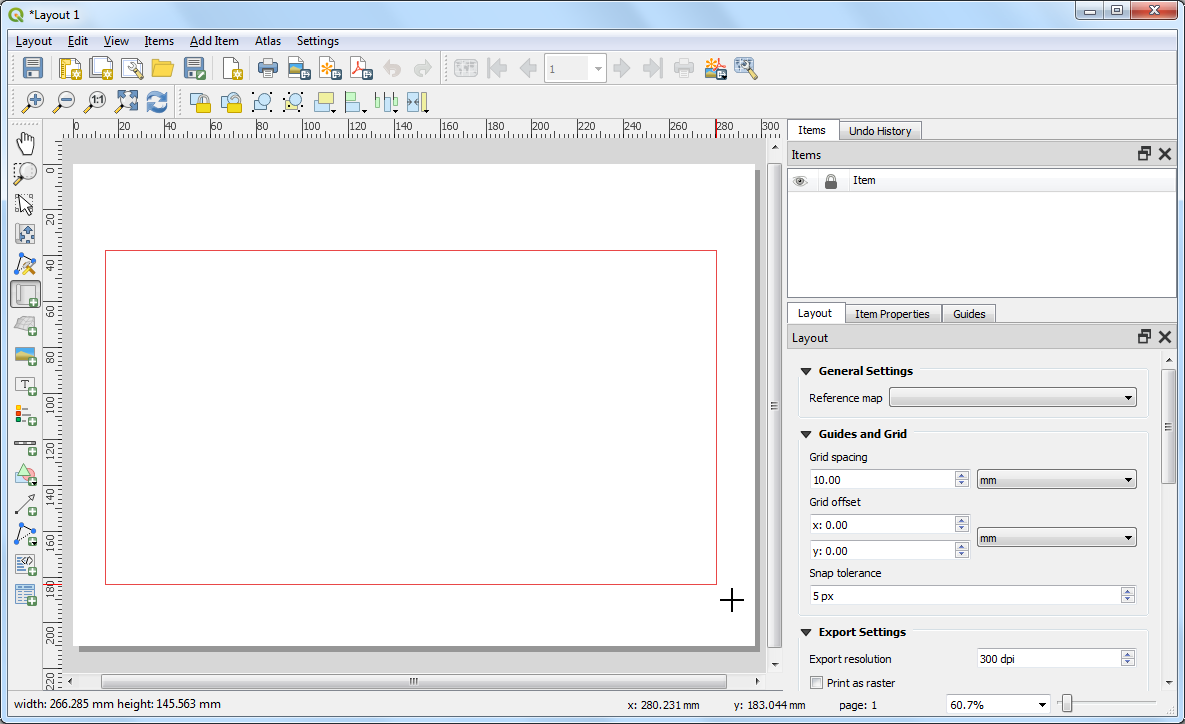
在地圖版面上拖曳一塊你想插入地圖的區域。
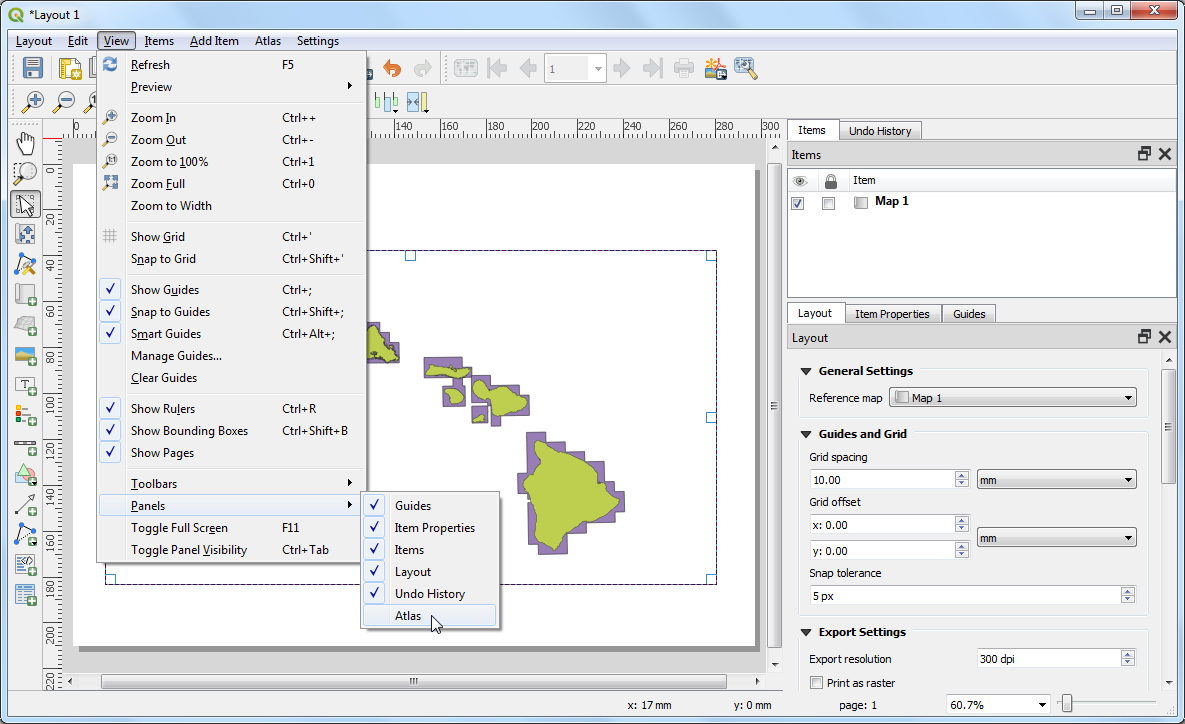
In QGIS3, the Atlas tab is not visible by default. Select .
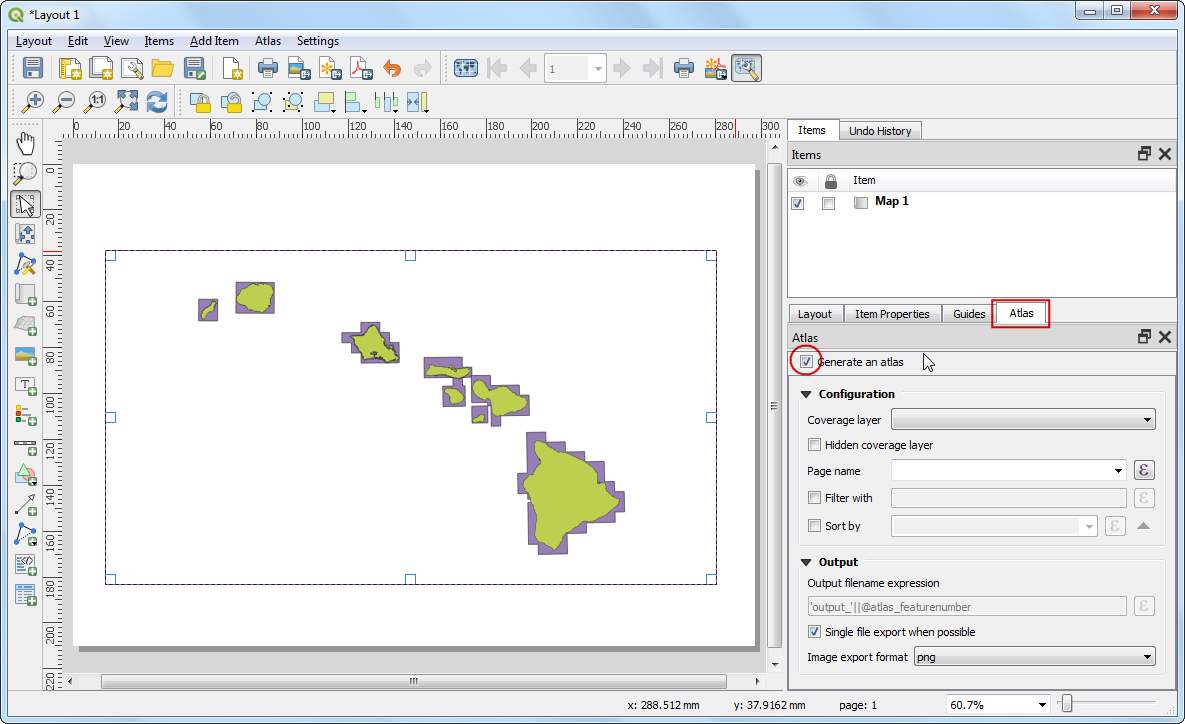
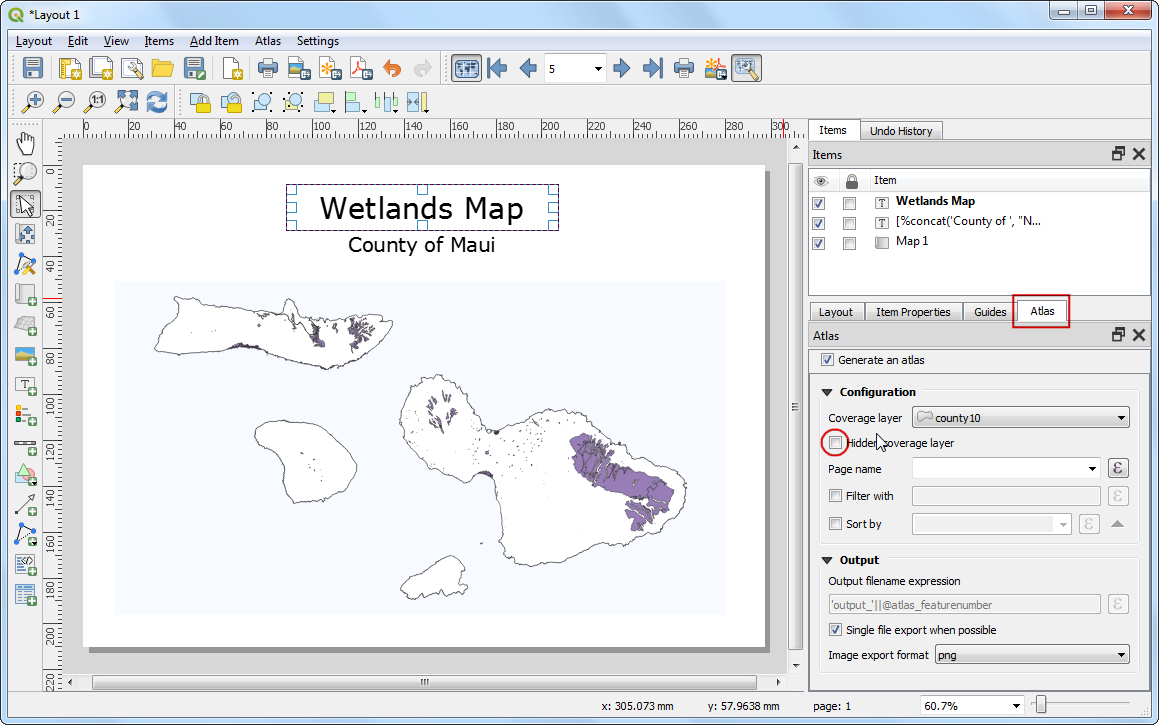
Switch to the Atlas tab. Check the Generate an atlas box.
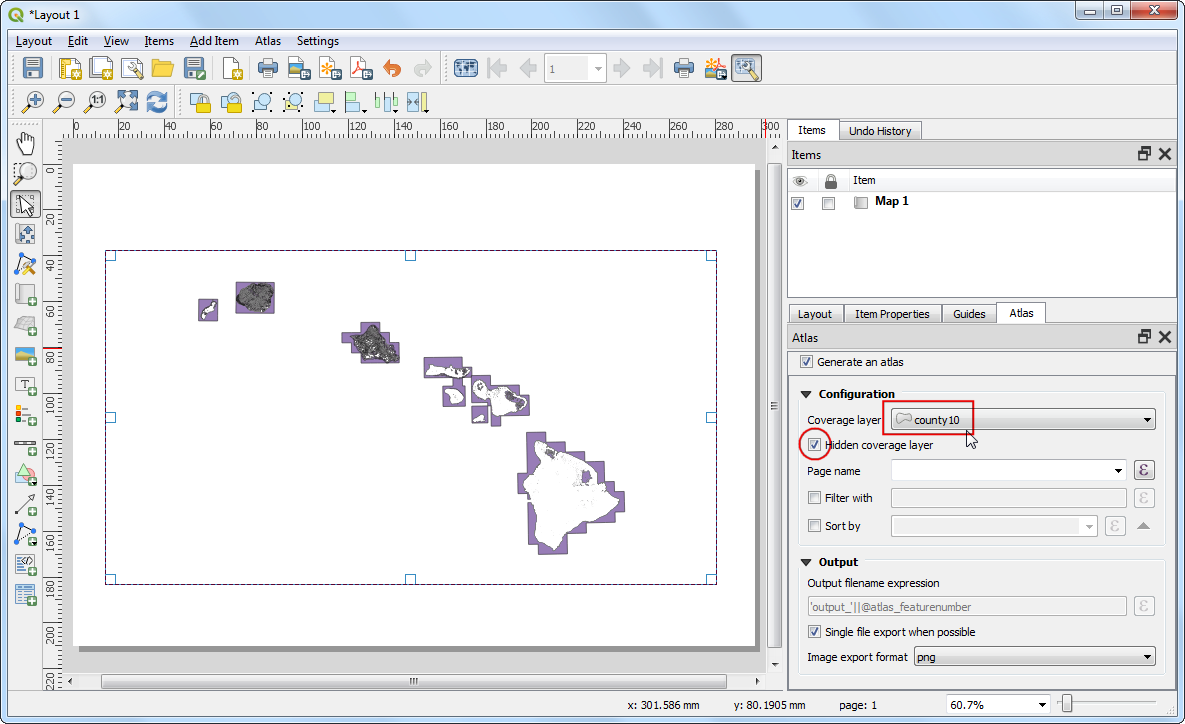
Select the
county10as the Coverage layer. This will indicate that we want to create 1 map each for every polygon feature in thecounty10layer. You can also check the Hidden coverage layer so that the features themselves will not appear on the map.
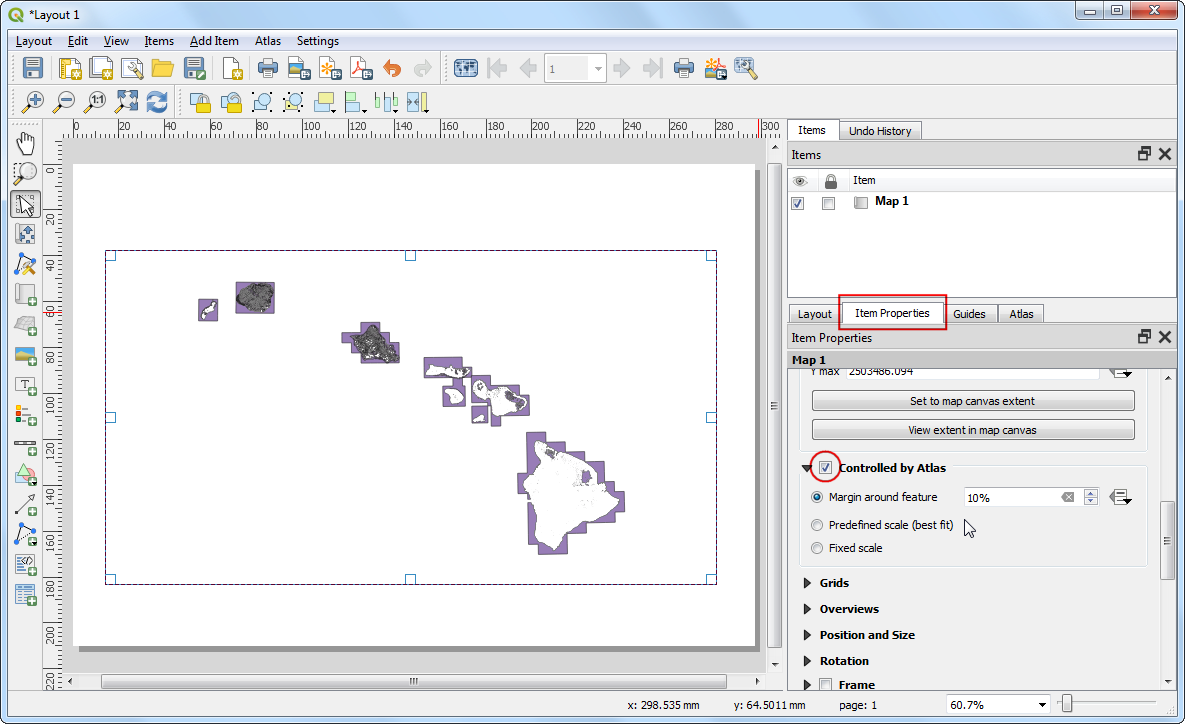
Switch to the Item Properties tab. Scroll down and check the Controlled by atlas box. This will indicate the layout that the content of the map displayed in this item will be determined by the
Atlastool.
備註
You must enable the Generare an atlas box in the Atlas tab, otherwise the Controlled by atlas checkbox will be diasbled.
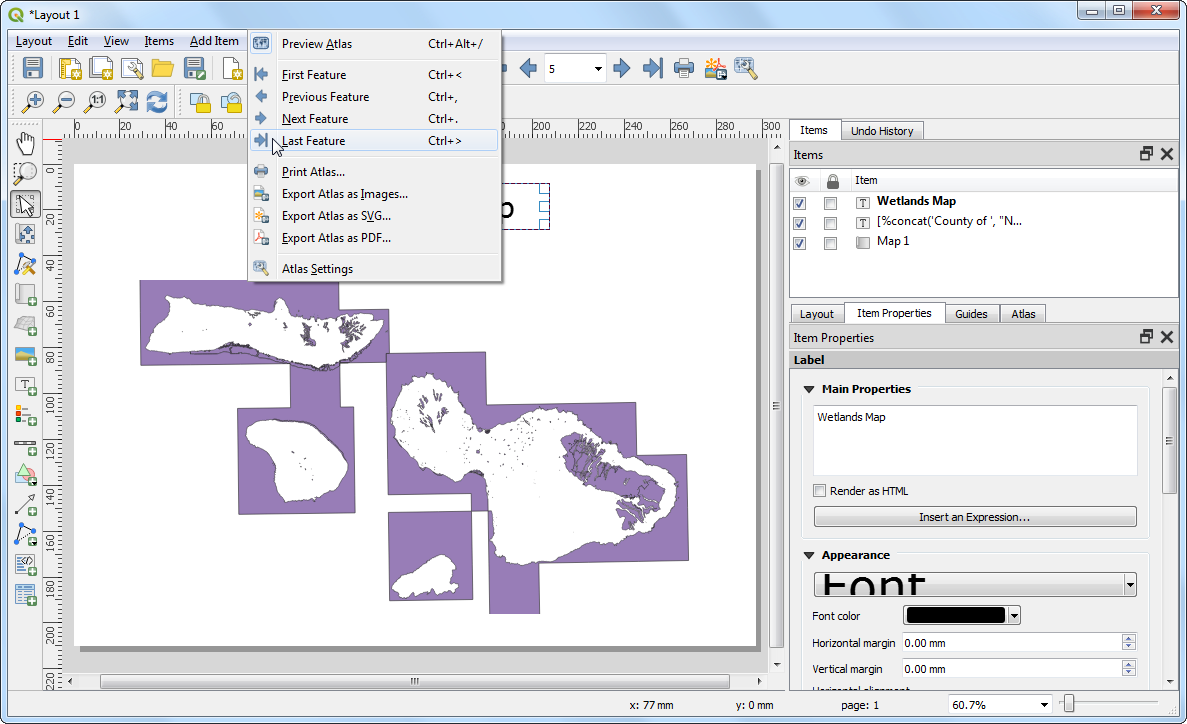
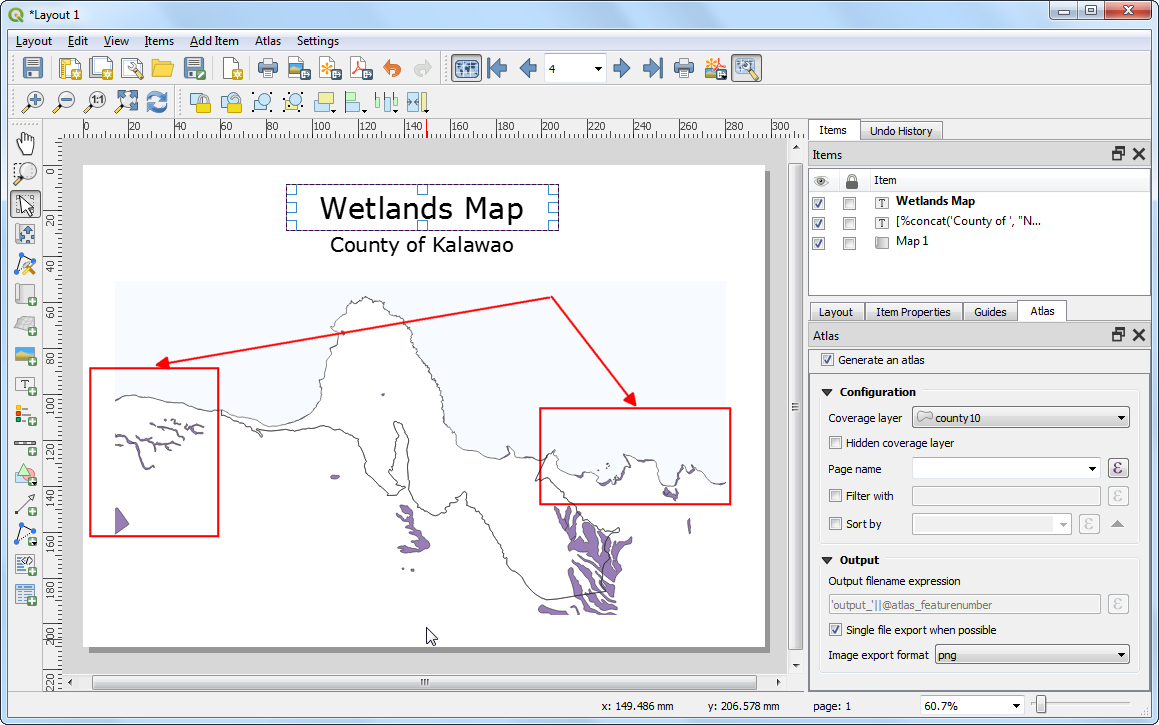
Now that you have configuring the Atlas settings, go to .
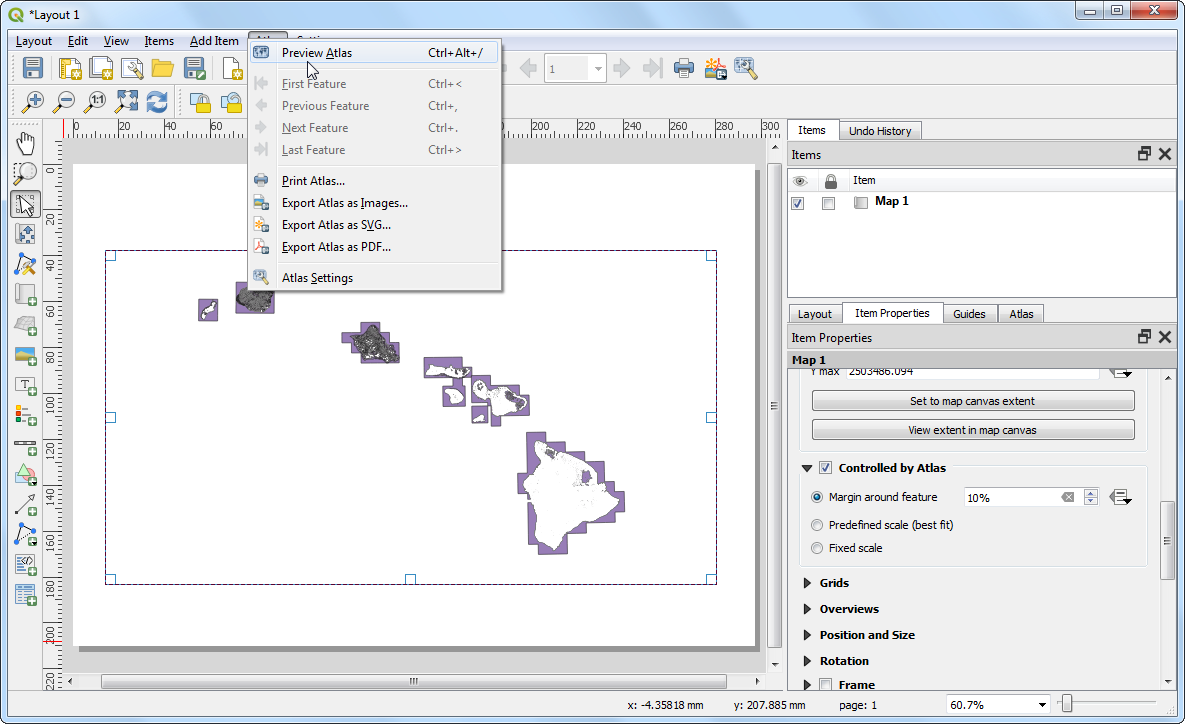
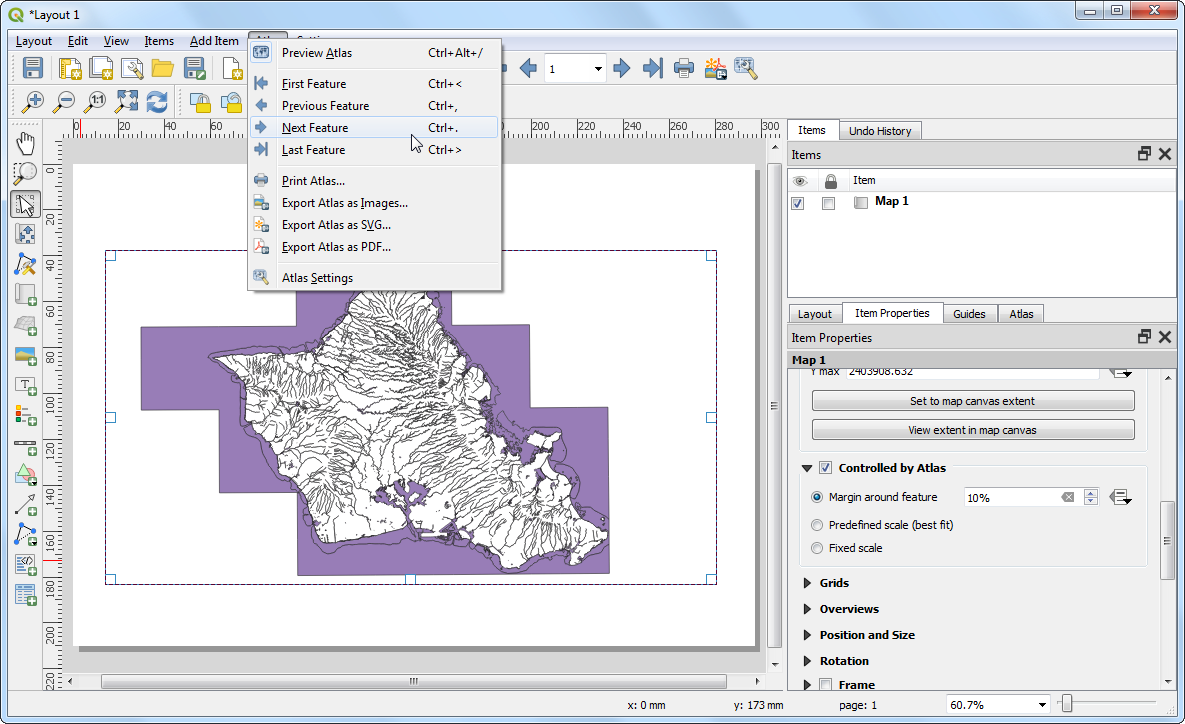
You will see the map refresh and show how individual map will look like. You can preview how the map will look for each of the county polygons. Go to . Atlas will render the map to the extent of the next feature in the coverage layer.
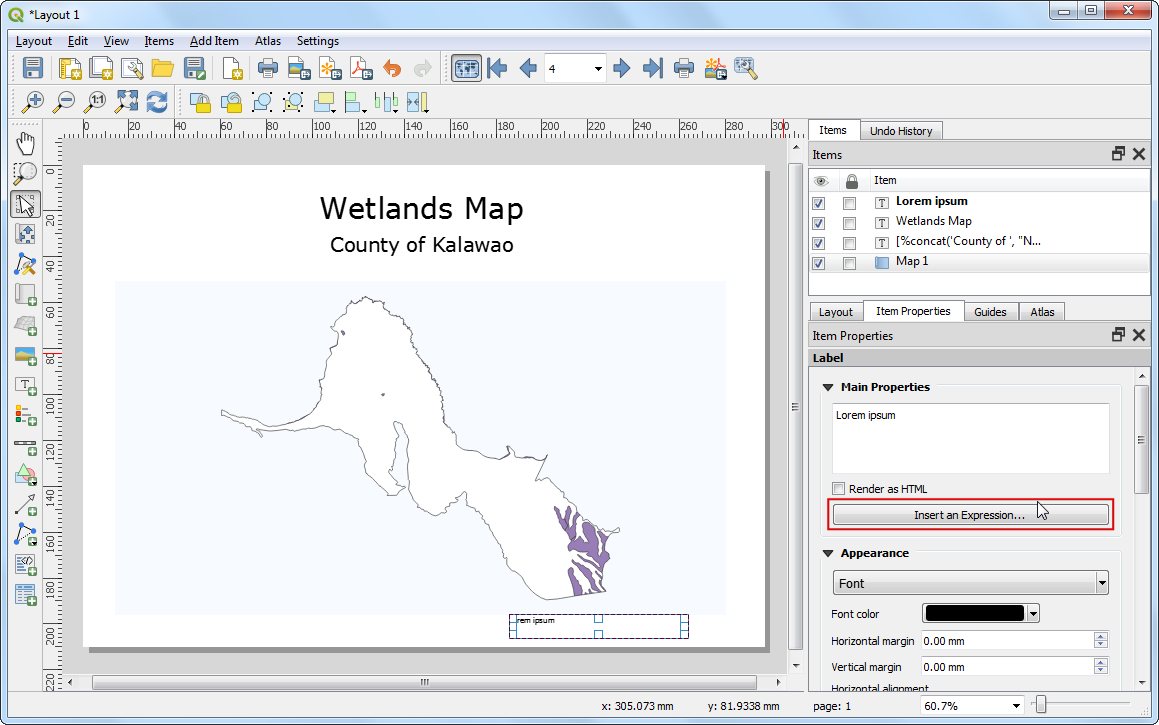
來加點標記吧!選擇 ,
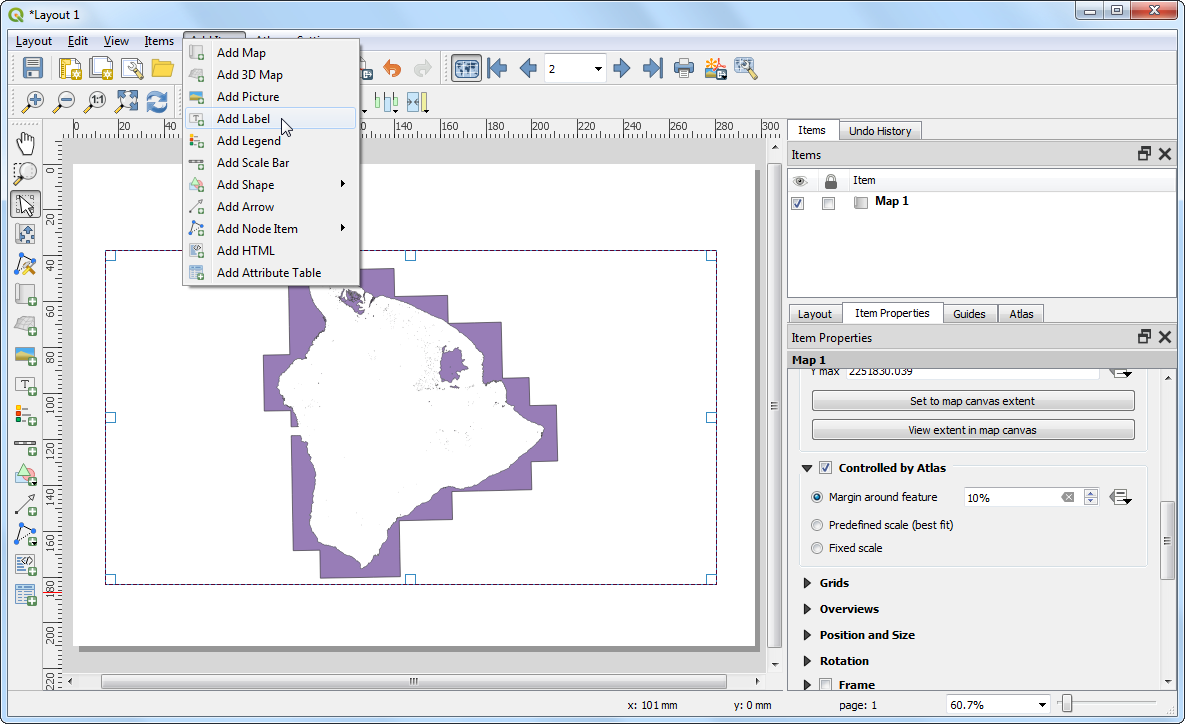
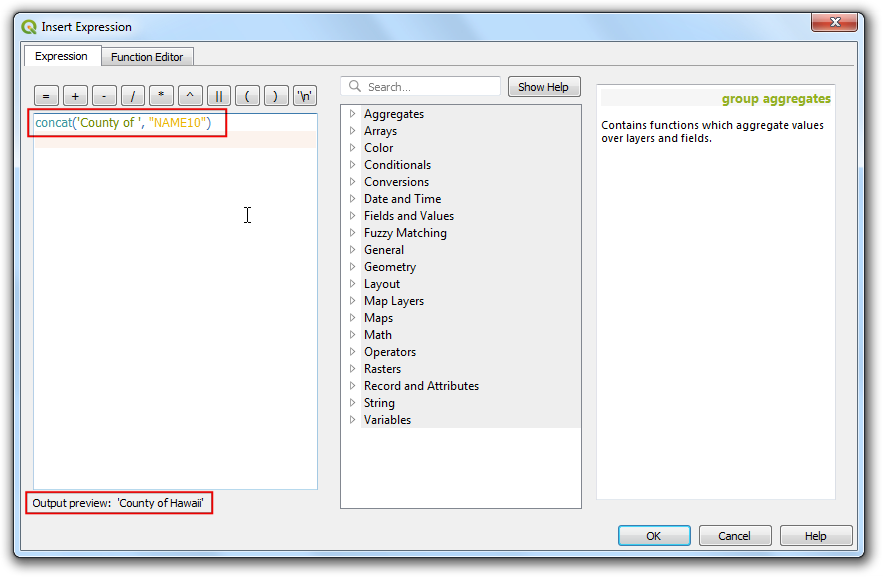
Under the Item properties tab, locate the Main properties section and click Insert an Expression... button.
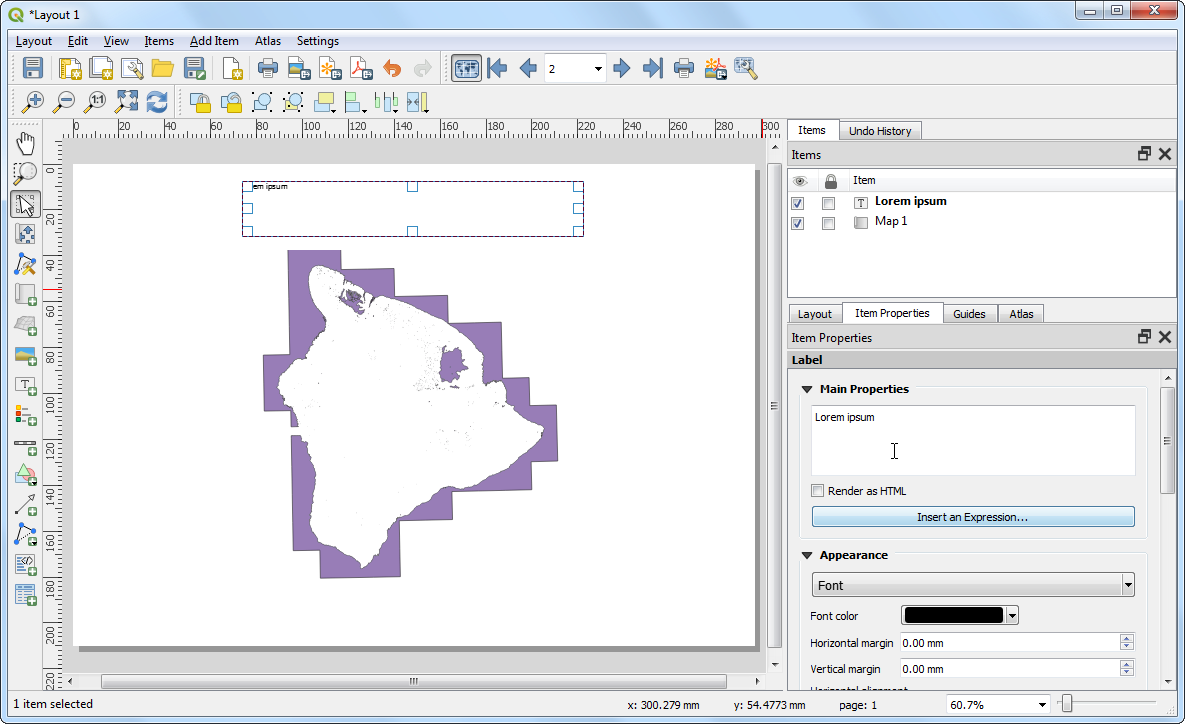
在此功能中,標記文字可以使用覆蓋圖層的屬性。我們要使用
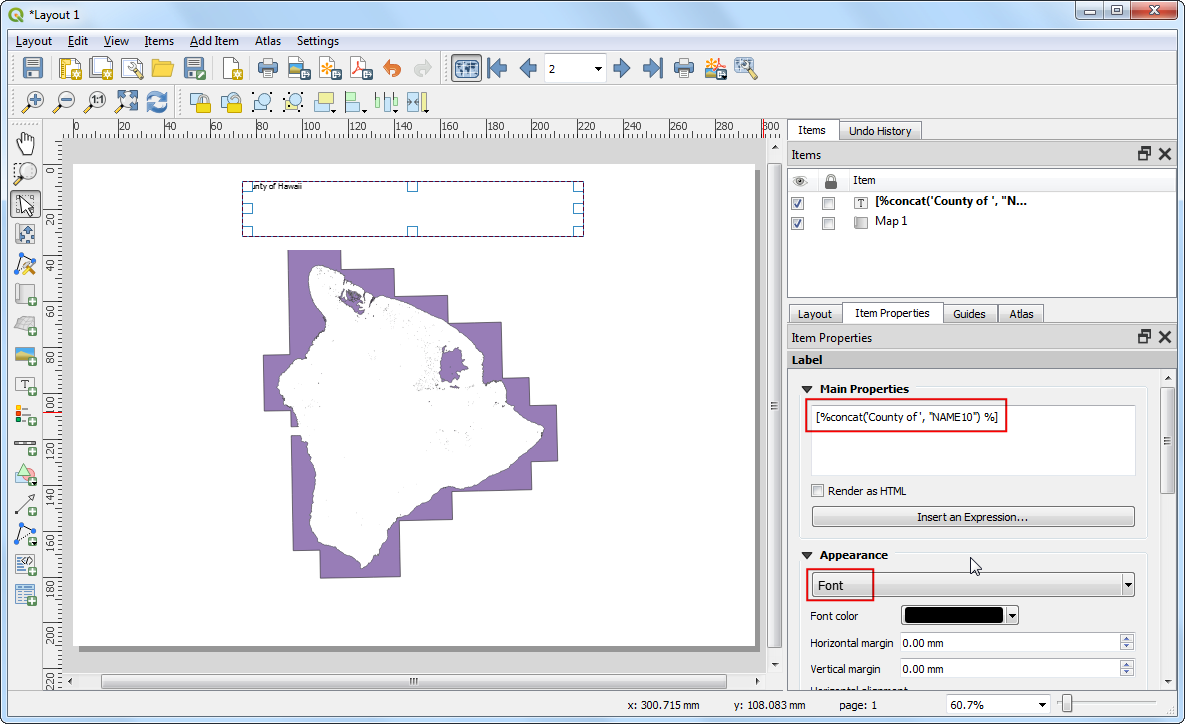
concat函數來把兩段字串合併,而要合併的字串分別為County of和county10圖層中的NAME10屬性值。加入以下的表達式後,按下 確定。
concat('County of ', "NAME10")
Delete the leading Lorem ipsum placeholder text so that the textbox contains only the expression. Scroll down to the Appearance section and click on the Font dropdown. Choose the font and adjust the size to your liking.
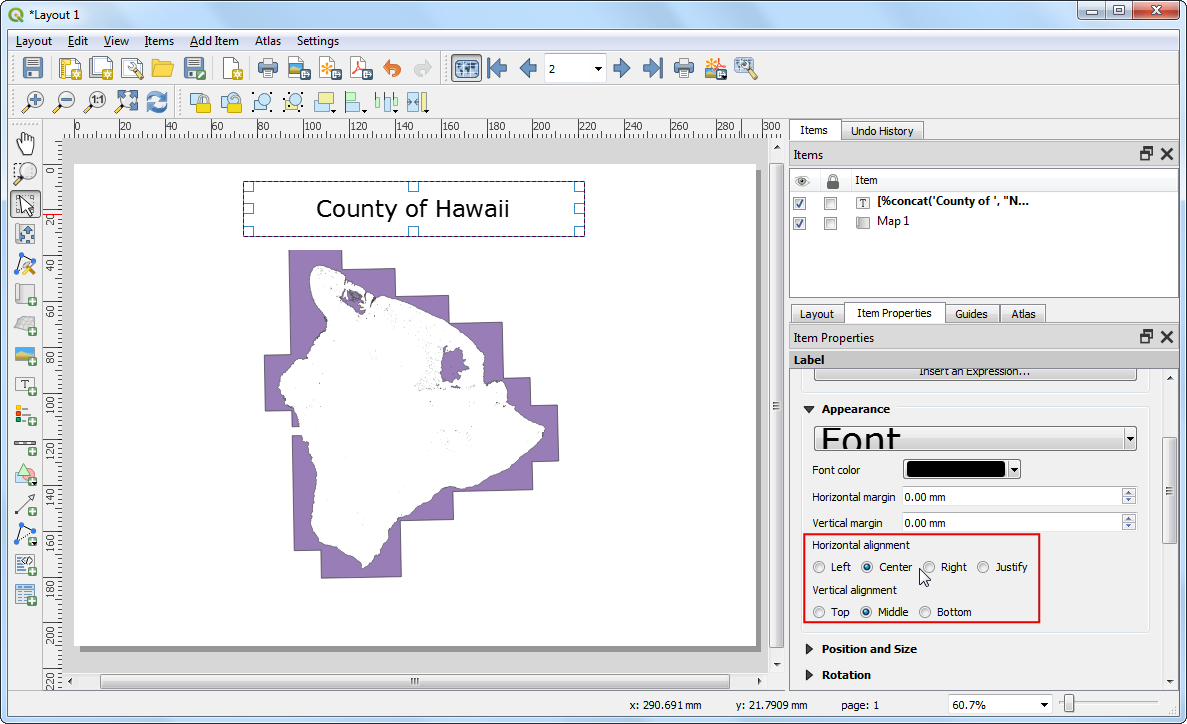
Choose
Centeras the Horizontal alignment andMiddleas the Vertical alignment option.
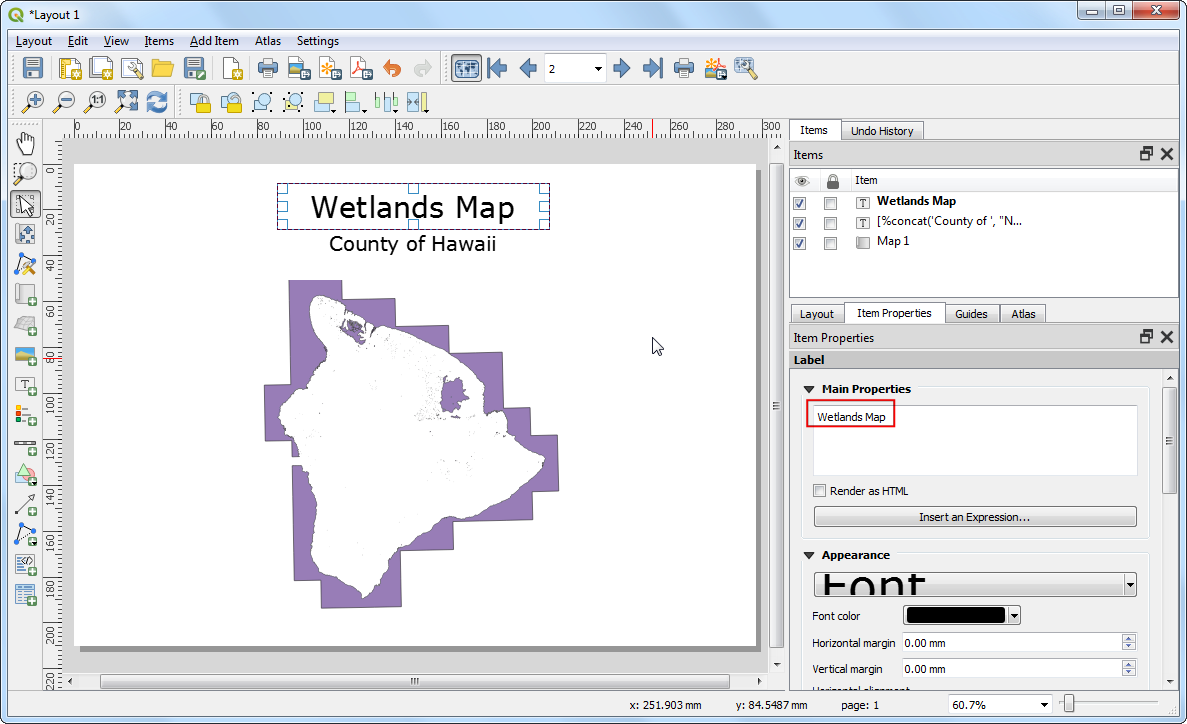
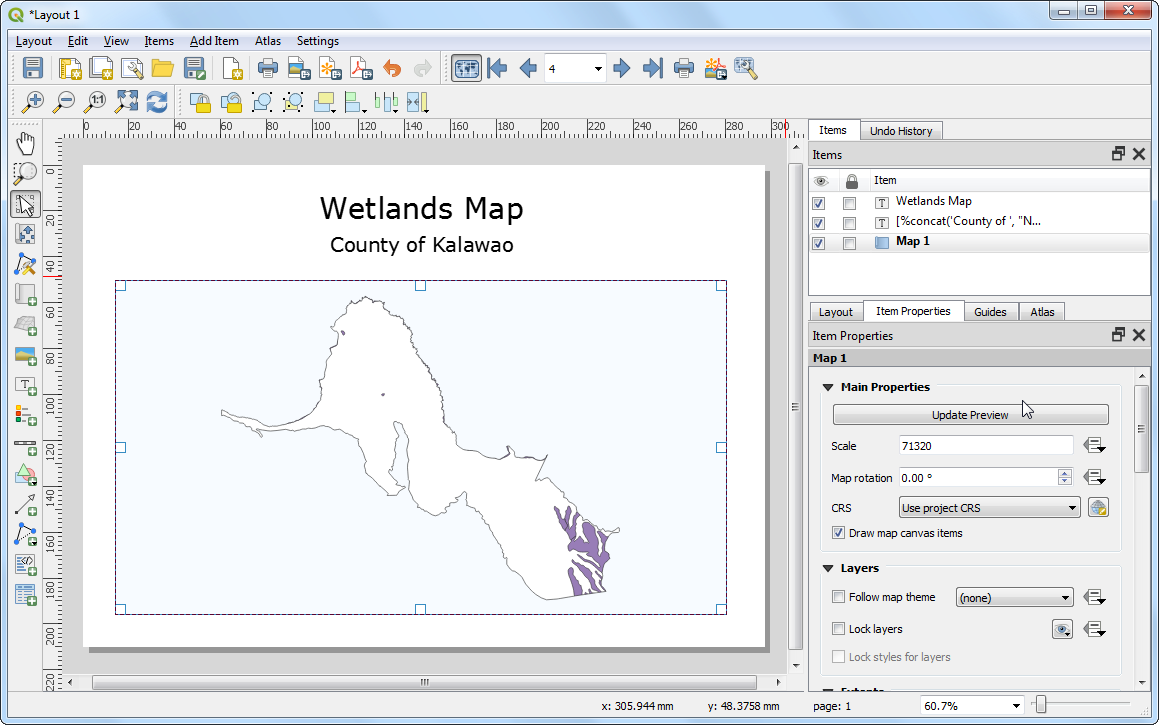
加入另一個標記,然後在 主要屬性 下輸入
Wetlands Map。由於沒有使用表達式,此文字在所有的地圖中都會相同。
選擇 ,然後確認地圖標記有照我們所想的運作。目前濕地地圖上的多邊形也延伸到了海中,看起來不怎麼美觀,所以接著我們就要來改變樣式,隱藏郡縣邊界外側的多邊形圖徵。
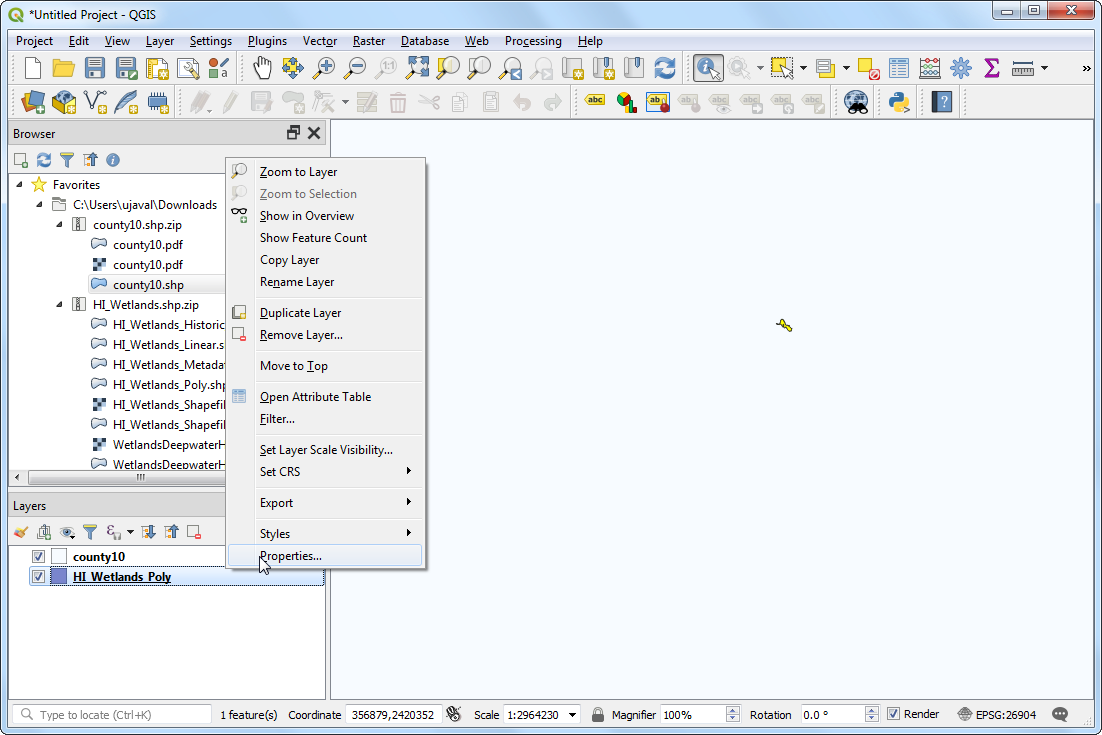
切換到 QGIS 主視窗,在
county10圖層上按右鍵選擇 屬性。
In the Symbology tab, select the Inverted polygons renderer. This renderer styles the outside of the polygon - not inside. Select white as the fill color and click OK.
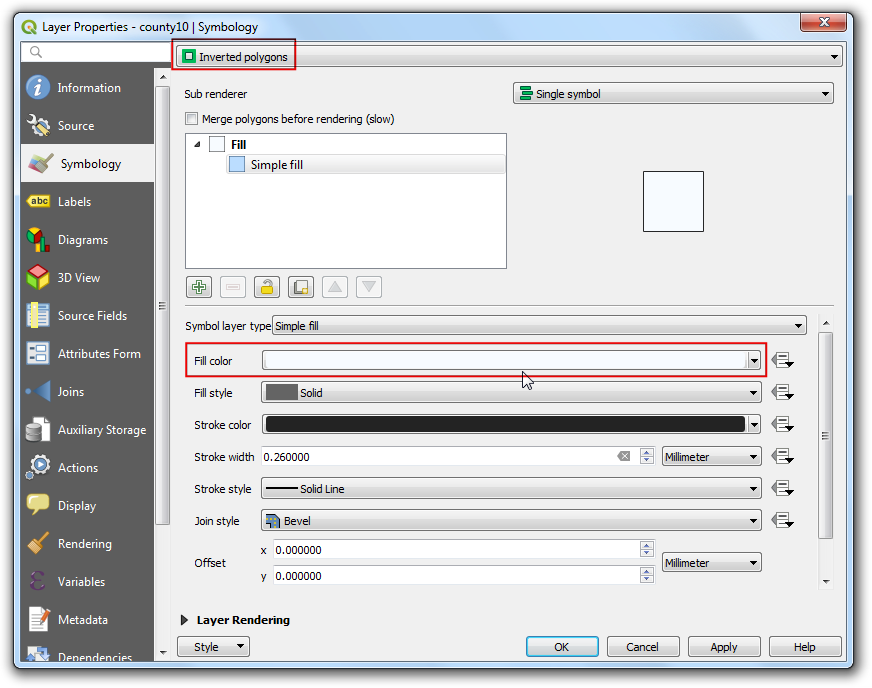
You will notice that the polygons extending outside of the county boundaries are now disappeared. In reality, they are hidden by the white color fill extending out from the county polygons because of the Inverted polygons style.

Switch to the Layout window. If we want the effect of the inverted polygons to show, we need to uncheck the Hidden coverage layer box under Atlas tab. Once unchecked, the rendered image will appear clean and areas outside the coverage polygon is not visible.
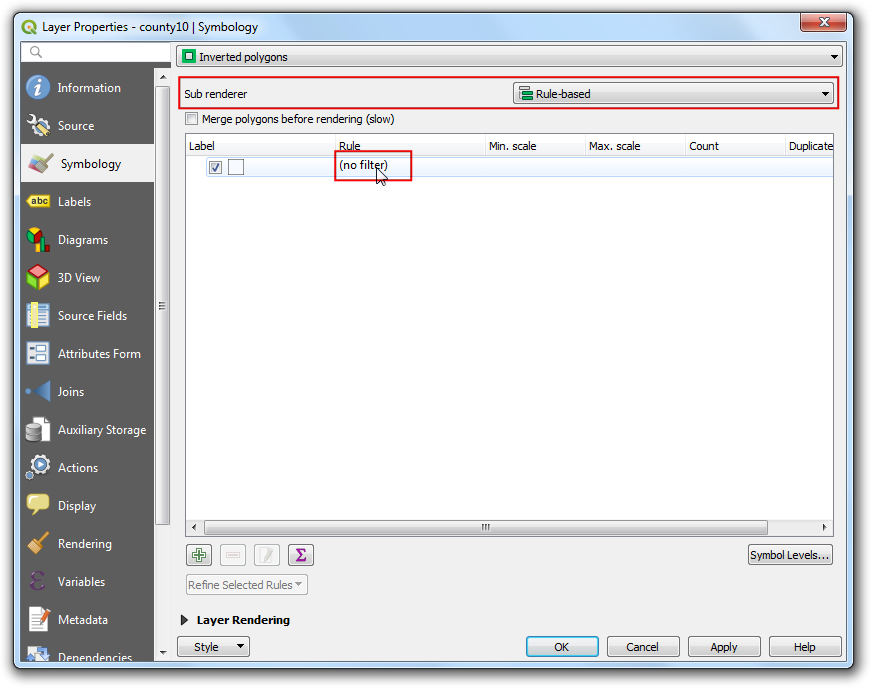
There is one more problem though. You will notice that in some cases, parts of the map that are outside the coverage layer boundary are still visible. This is because Atlas doesn't automatically hide other features. This can be useful in some cases, but for our purpose, we only want to show wetlands of the county whose map is being generated. To fix this, switch back to the main QGIS window and right-click the
county10layer and select Properties.
In the Symbology tab, select
Rule-basedas the Sub renderer. Double-click the area under Rule.
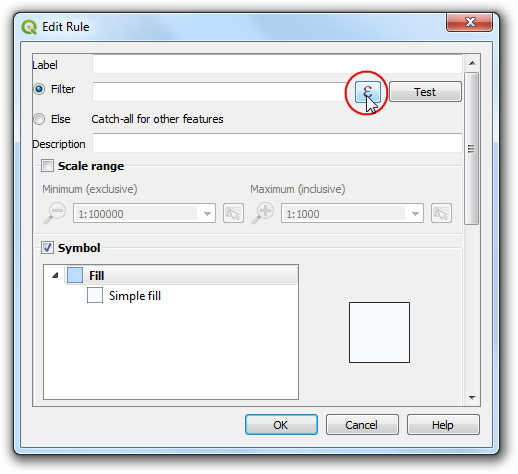
In the Edit rule dialog, click the Expression button next to Filter.
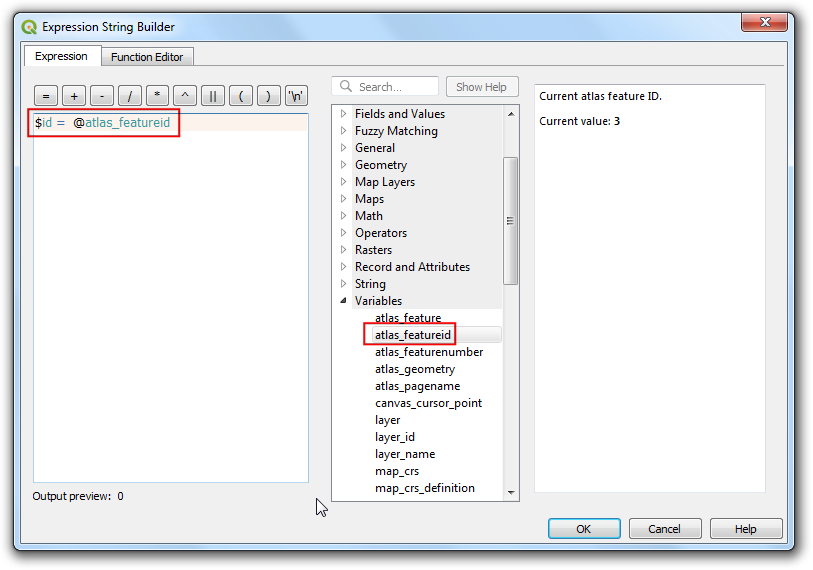
In the Expression string builder, expand the Variables group of functions. The
@atlas_featureidvariable stores the id of the the currently selected feature. We will construct an expression that will select only the currently selected Atlas feature. Enter the expression as below and click OK.
$id = @atlas_featureid
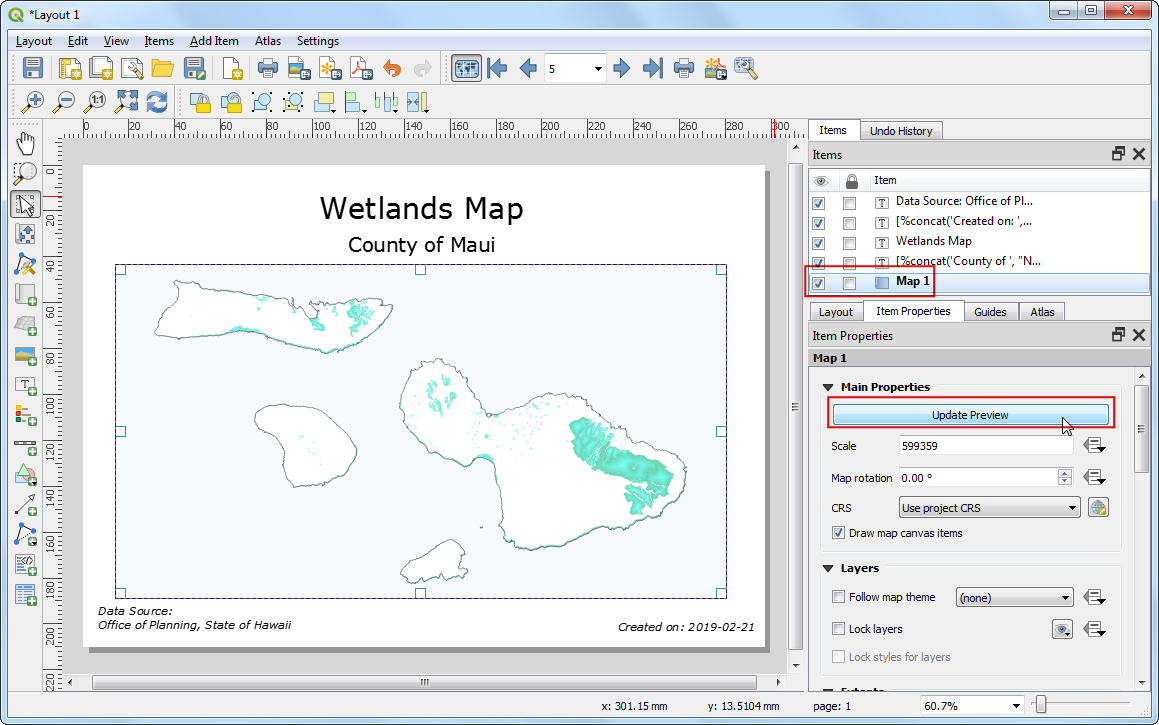
Close all intermediate dialogs and switch back to the Layout window. Select Map 1 item and click the Update preview button under Item properties tab to see the changes. Notice that now only the area covering the county boundary is shown.
備註
If you do not see the Update preview button, it may help to select another Item element first and then select Map 1 again.
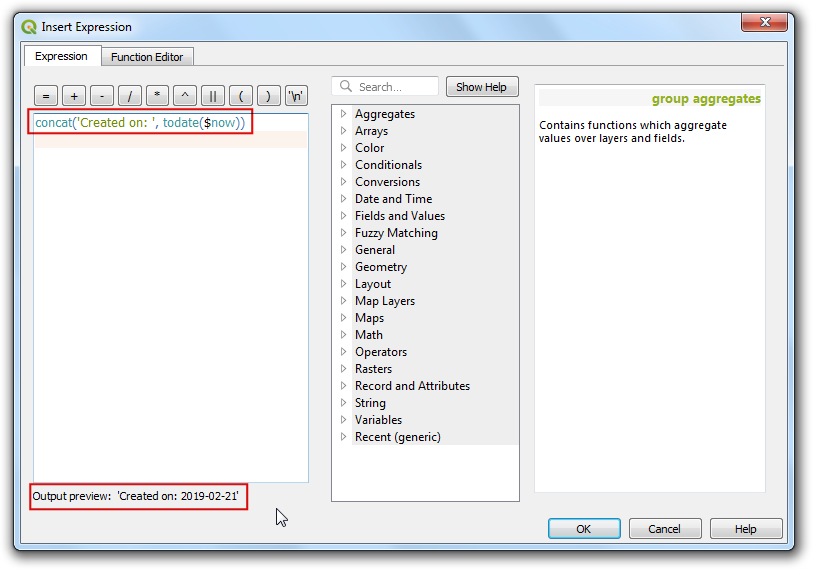
我們再來加入另一個新的標記,用來標示現在的日期。選擇 然後選擇地圖上的任一區域,完成後按下 插入表示式 鈕。
Expand the Date and Time functions group and you will find the
$nowfunction. This holds the current system time. The functiontodate()will convert this to a date string. Enter the expression as below and click OK.
concat('Created on: ', todate($now))
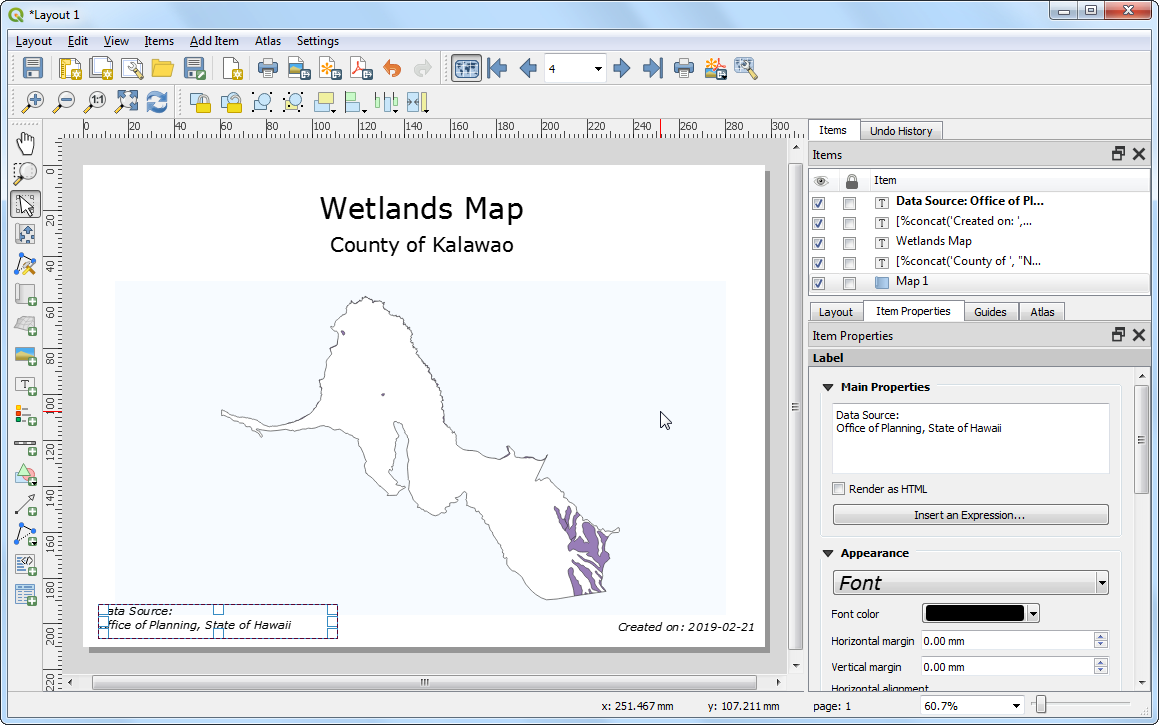
再加入另外一個標記,引用資料來源。你也可以順道加入其他的地圖元素,例如指北針等等,請參考 製作地圖 一章的說明。
We will make one last styling improvement. Switch back to the main QGIS window and right-click the
HI_Wetlands_Polylayer and select Properties.
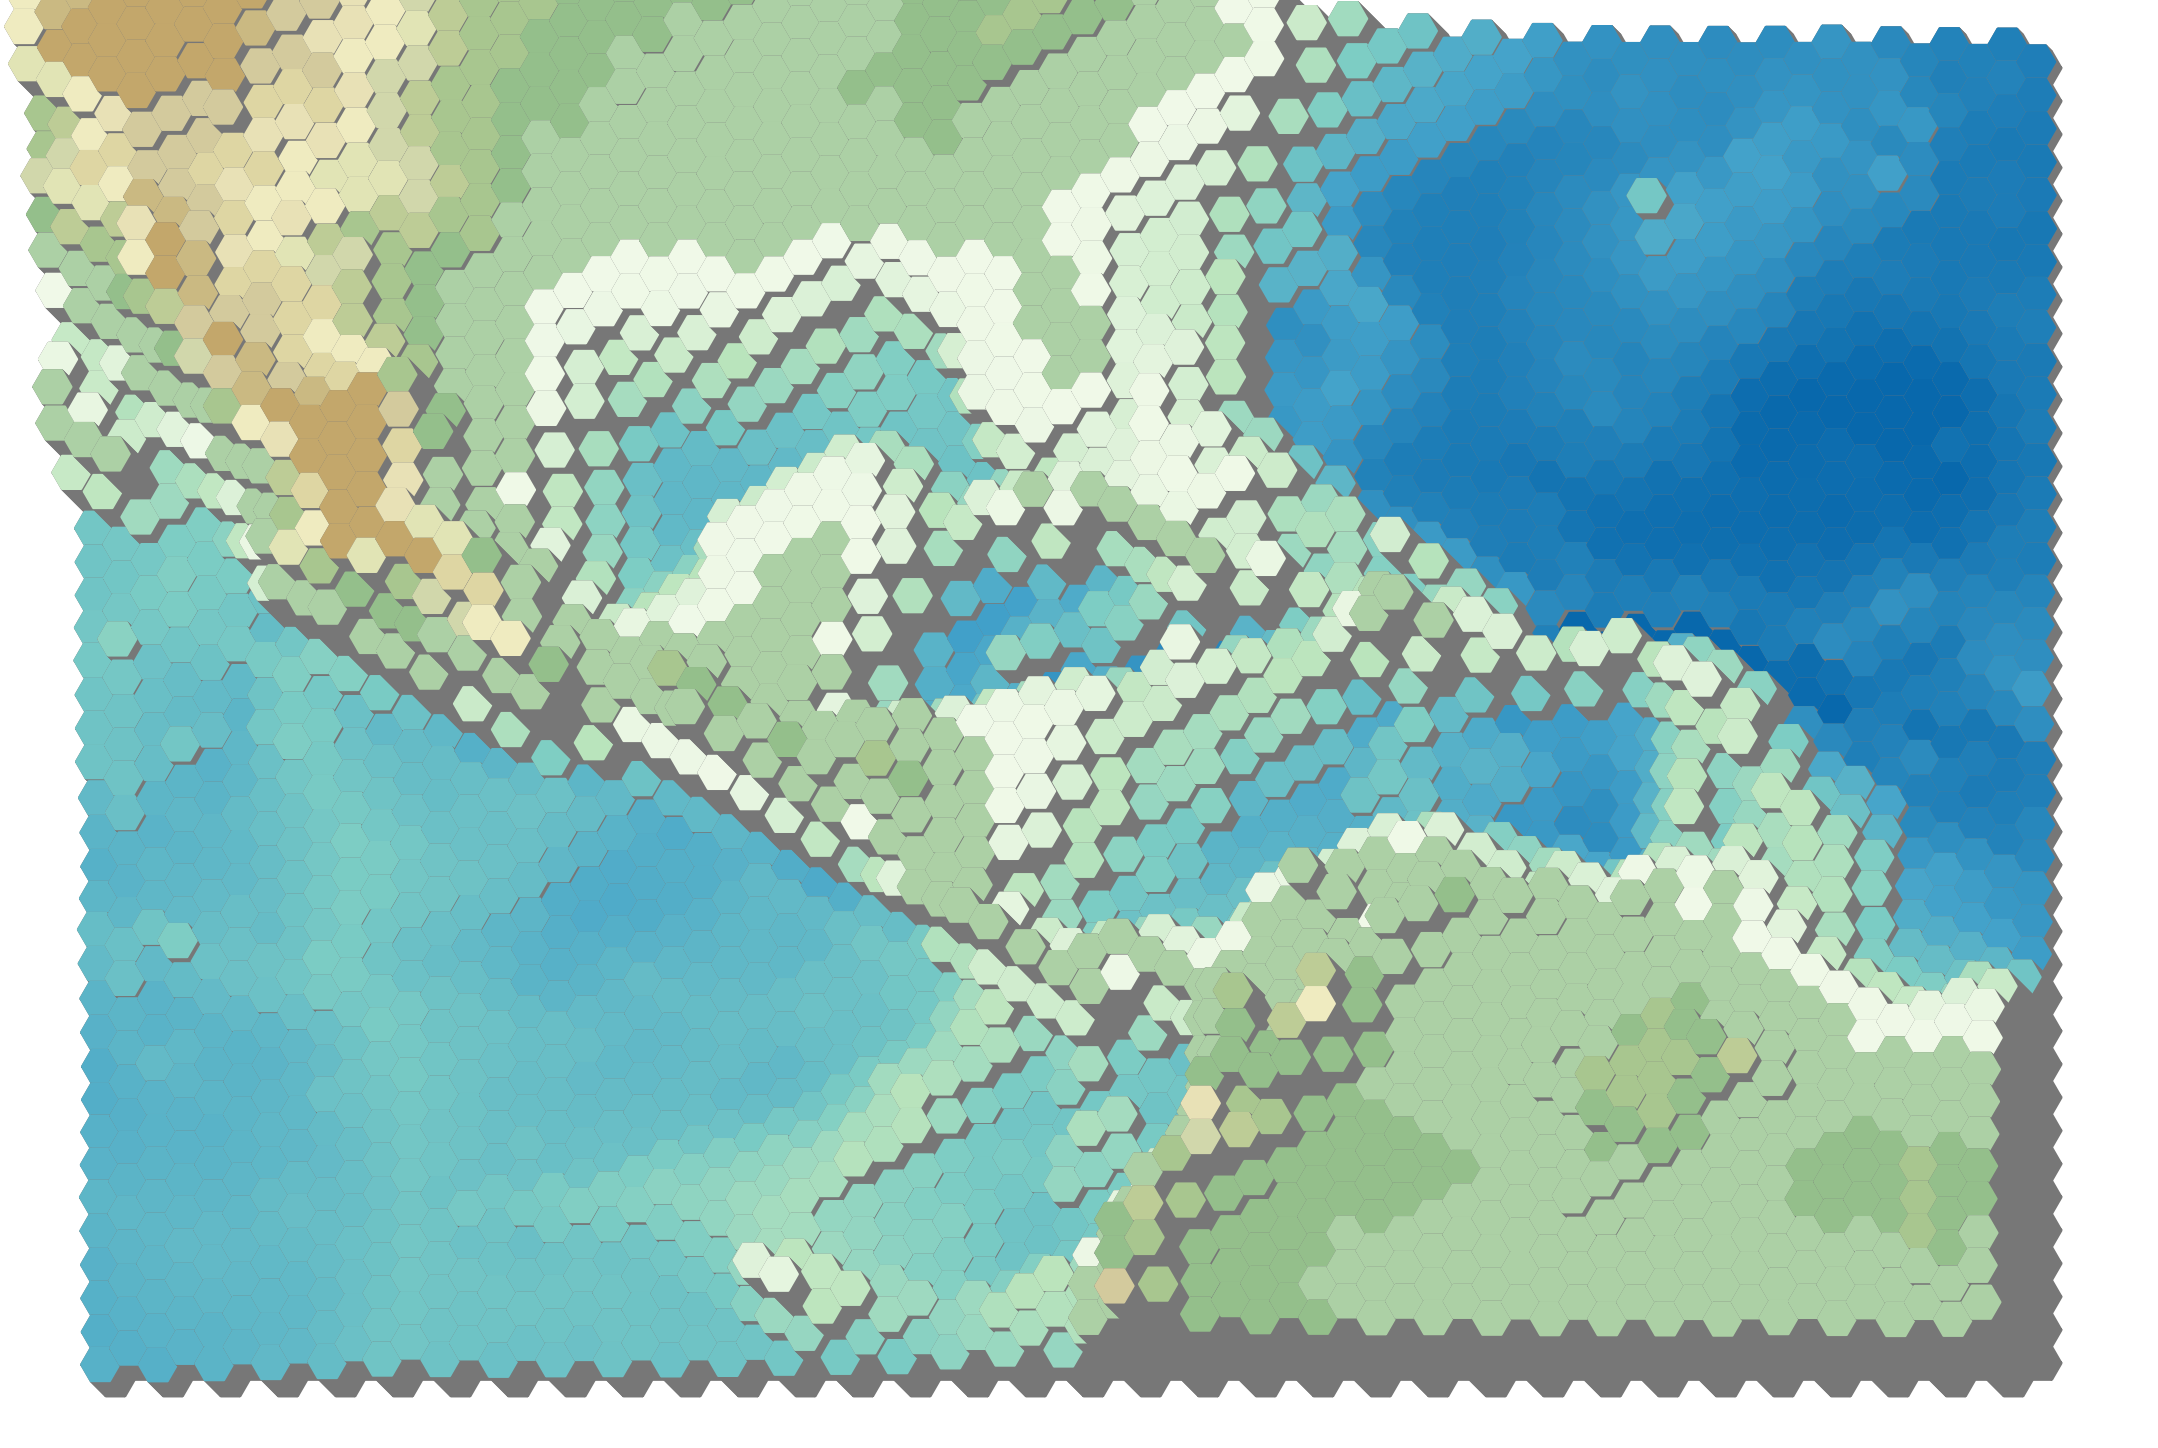
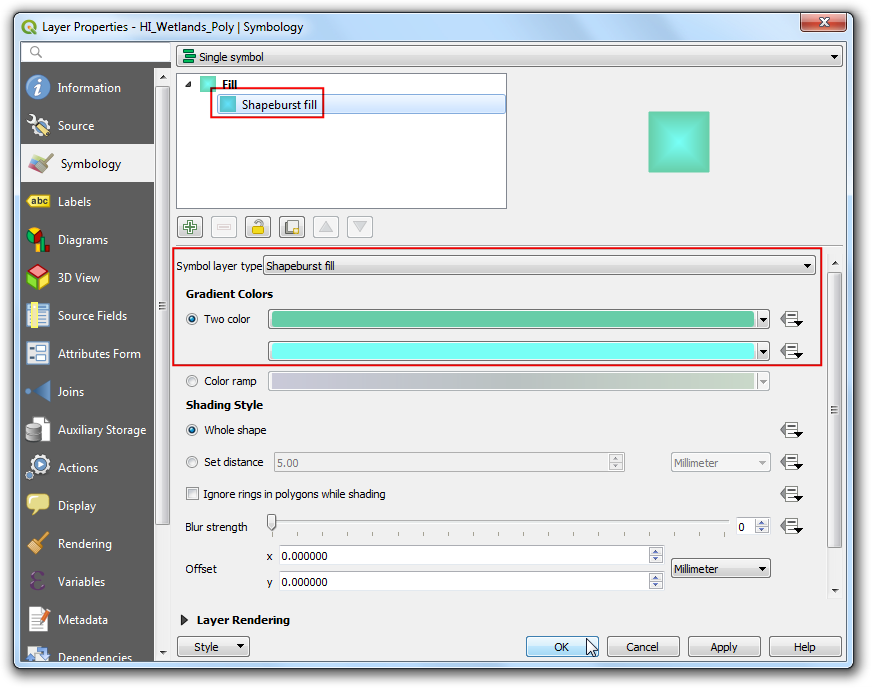
In the Symbology tab, click on Simple fill and select
Shapeburst fillas the Symbol layer type. Choose the Two color option and select shades of green and blue that you like. Click OK.
Select Map 1 item and click the Update preview button under Item properties tab to see the changes.
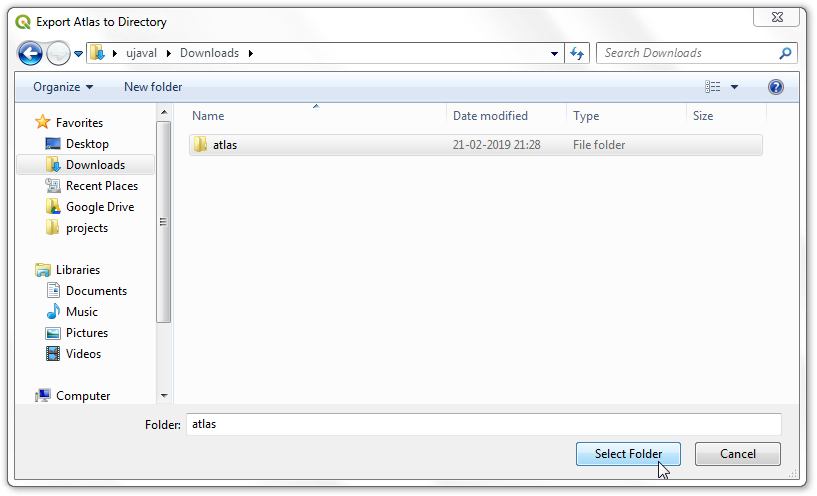
Once you are satisfied with the map layout and styling, go to .
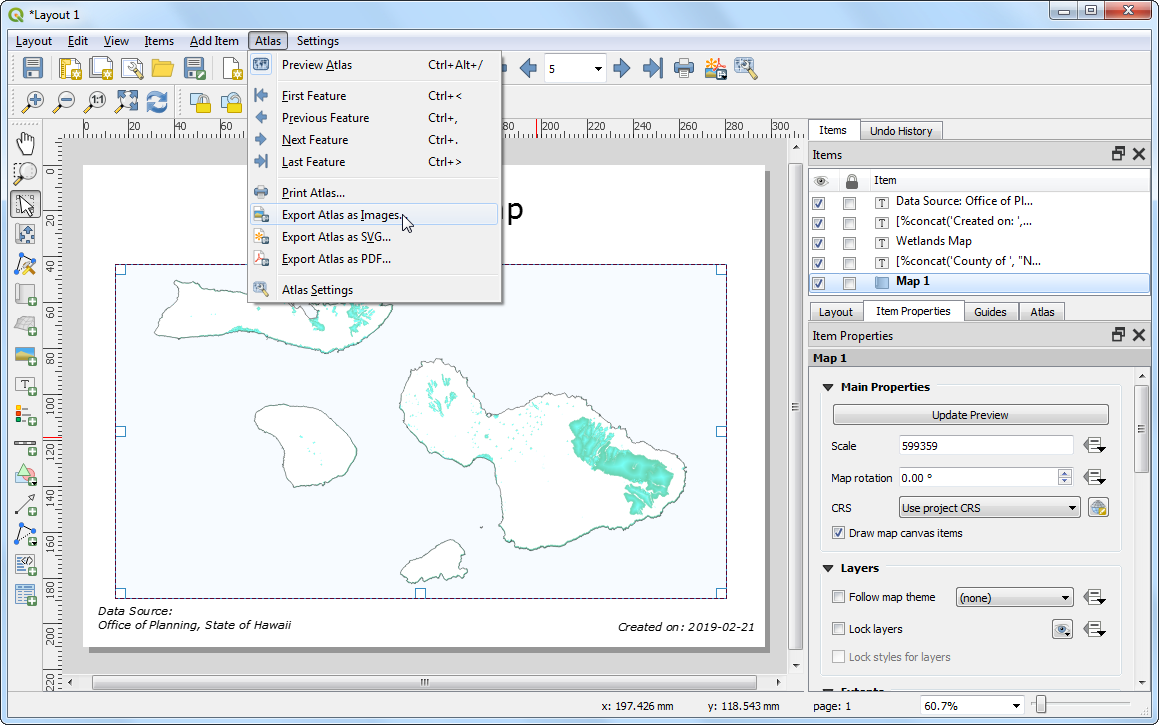
選擇電腦中的某資料夾,然後按下 選擇 鈕。
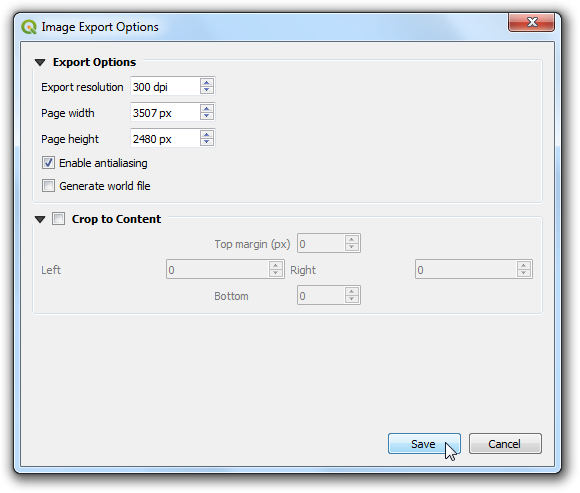
Leave the default options in the Image Export Options and click Save.
輿圖工具會自動地使用我們剛剛建立的範本,為覆蓋圖層中的每個圖徵創造各自的地圖。處理完成後,在資料夾中就能找到這些地圖。
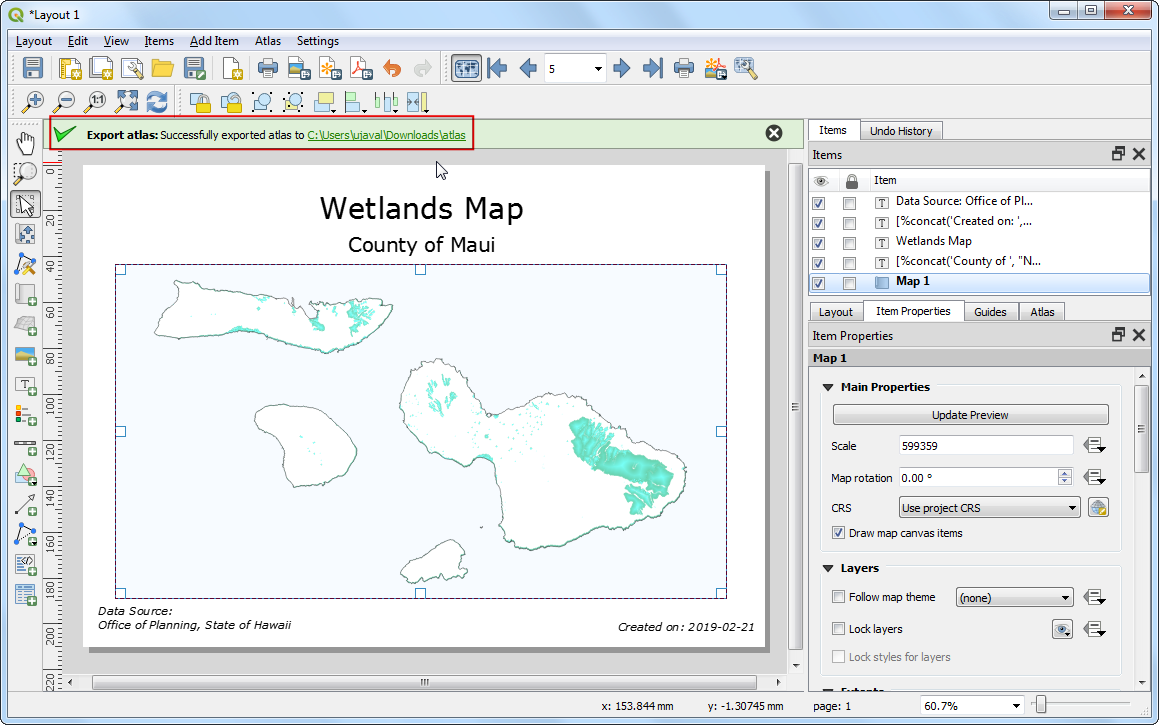
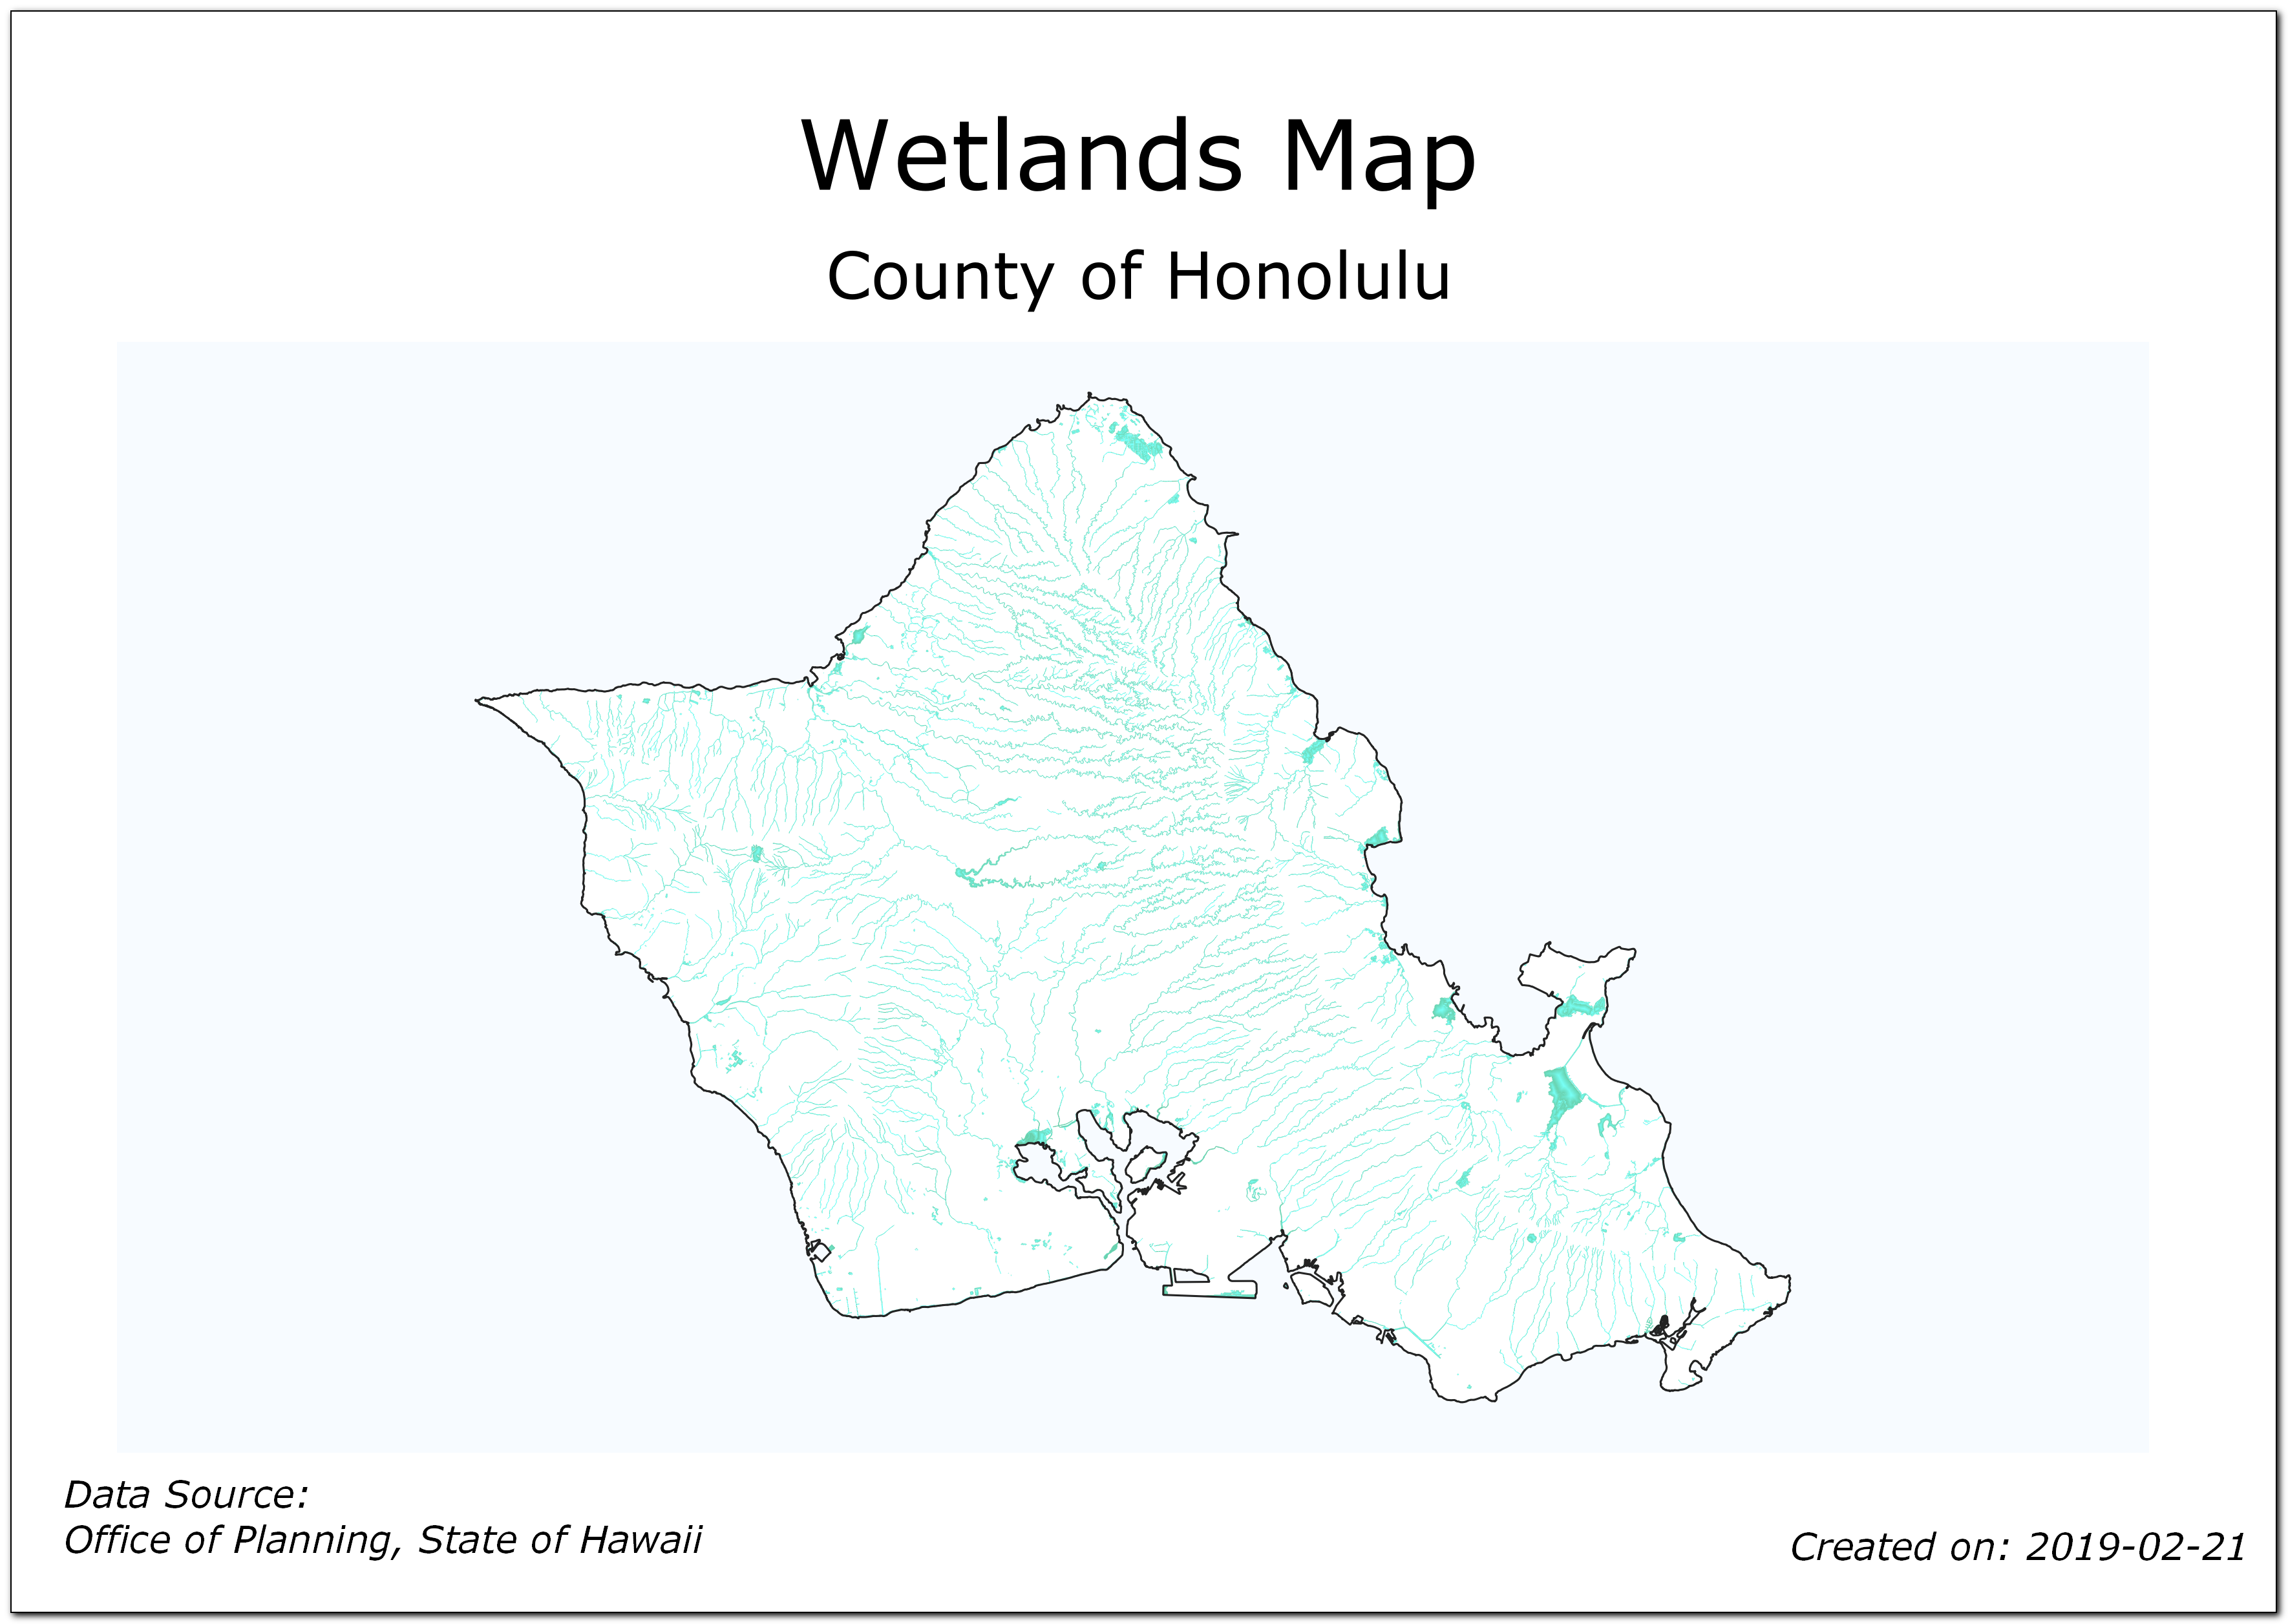
這裡放上完成版地圖以供參考。
If you want to give feedback or share your experience with this tutorial, please comment below. (requires GitHub account)