 Ujaval Gandhi
使用自訂的 Python 表達式函數 (QGIS3)
QGIS 表達式非常的強大,而且也使用在許多核心操作上,像是選取、計算影像值、樣式設定、標記等等。QGIS 也支援使用者自定義的表達式,只要使用一點點的 Python 程式,就可以設計自己的函數,然後把它安插到 QGIS 表達式的引擎中。
內容說明
We will define a custom function that finds the UTM zone number of a map feature and use this function to write an expression that displays the UTM zone as a map tip when hovered over the point.
你還會學到這些
使用
地圖提示(Map Tips)工具,在滑鼠游移在某圖徵上時顯示自訂的文字。
取得資料
我們要使用 Natural Earth 的 人口居住地 資料庫,請下載 `簡化版 (欄位較少) 的資料庫<http://www.naturalearthdata.com/http//www.naturalearthdata.com/download/10m/cultural/ne_10m_populated_places_simple.zip>`_。
操作流程
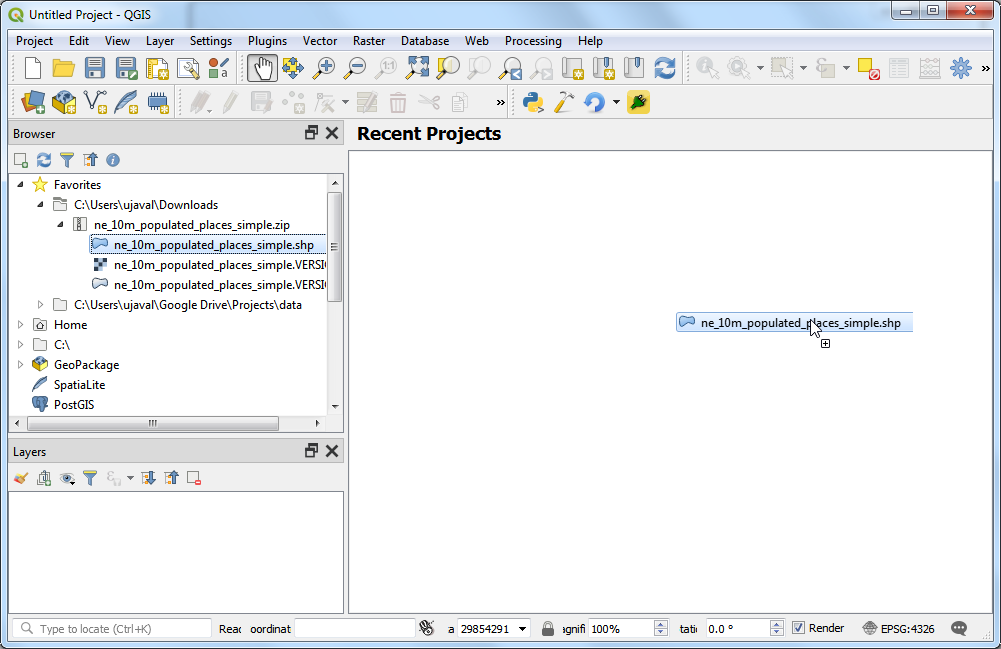
Locate the
ne_10m_populated_places_simple.zipfile in the QGIS Browser and expand it. Select thene_10m_populated_places_simple.shpfile and drag it to the canvas.
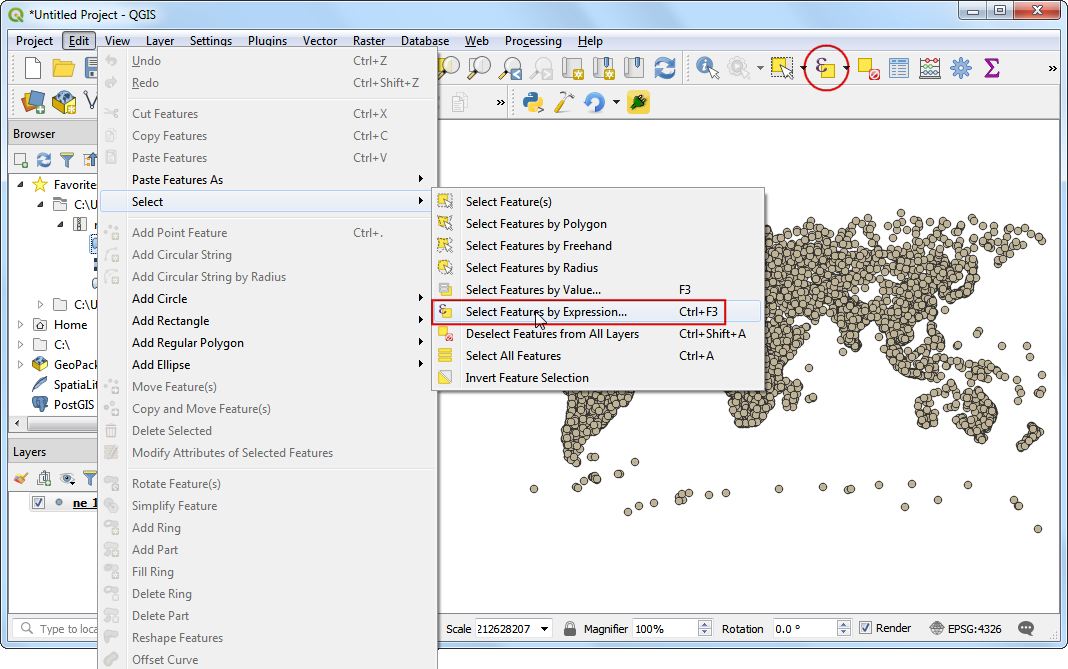
Go to or click the Select features using an expression button on the Attributes Toolbar.
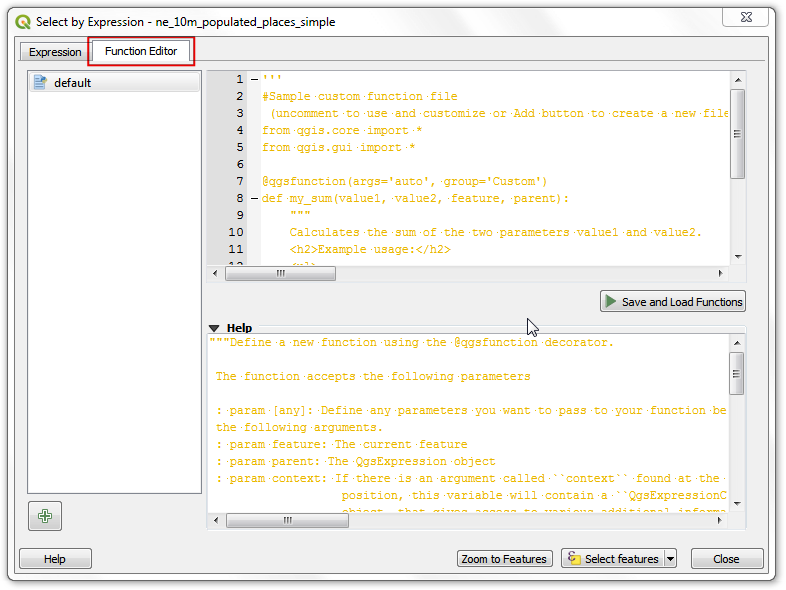
In the Select by Expression dialog, switch to the Function Editor tab. Here you can write any PyQGIS code that will be executed by the expression engine.
We will define a custom function named
GetUtmZonethat will calculate the UTM zone number for each feature. Since custom functions in QGIS work at the feature level. We will use the centroid of the feature's geometry and compute the UTM Zone from the latitude and longitude of the centroid geometry. We will also add a 'N' or 'S' designation to the zone to indicate whether the zone is in the northern or southern hemisphere. Press the + button in the lower left of the screen and typeutm_zones.pyas the file name. You can click the Help label in the bottom panel to close it and expand the code panel.
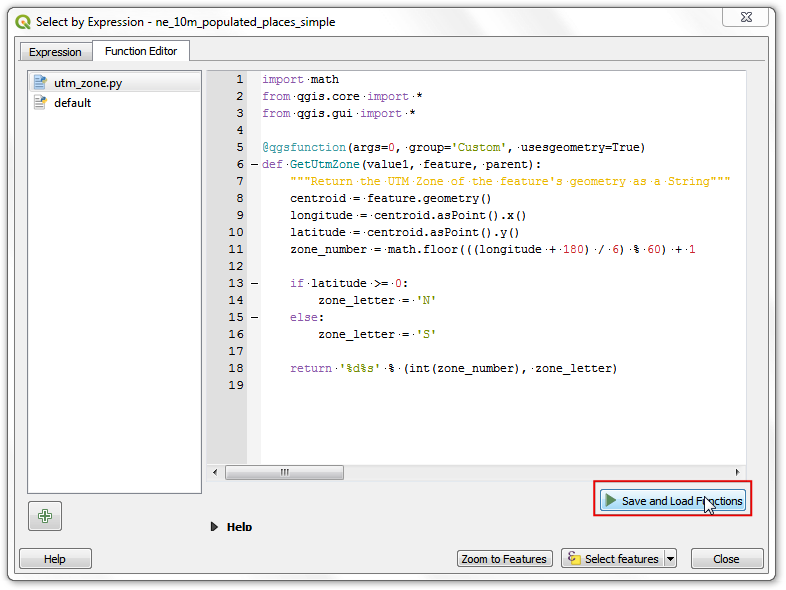
UTM Zones are longitudinal projection zones numbered from 1 to 60. Each UTM zone is 6 degree wide. Here we use a simple mathematical formula to find the appropriate zone for a given longitude value. This formula works for all except a few special UTM zones. Type the following code into the editor window. When you are finished click Save and Load Functions.
import math
from qgis.core import *
from qgis.gui import *

@qgsfunction(args=0, group='Custom', usesgeometry=True)
def GetUtmZone(value1, feature, parent):
    """Return the UTM Zone of the feature's geometry as a string"""
    centroid = feature.geometry().centroid()
    if centroid:
      longitude = centroid.asPoint().x()
      latitude = centroid.asPoint().y()
      zone_number = math.floor(((longitude + 180) / 6) % 60) + 1

      if latitude >= 0:
          zone_letter = 'N'
      else:
          zone_letter = 'S'

      return '%d%s' % (int(zone_number), zone_letter)
  else:
    return None
備註
Currently there is no way to delete an expression file from the GUI. If you wish to delete the utm_zone.py file, you can go to and delete the file from .
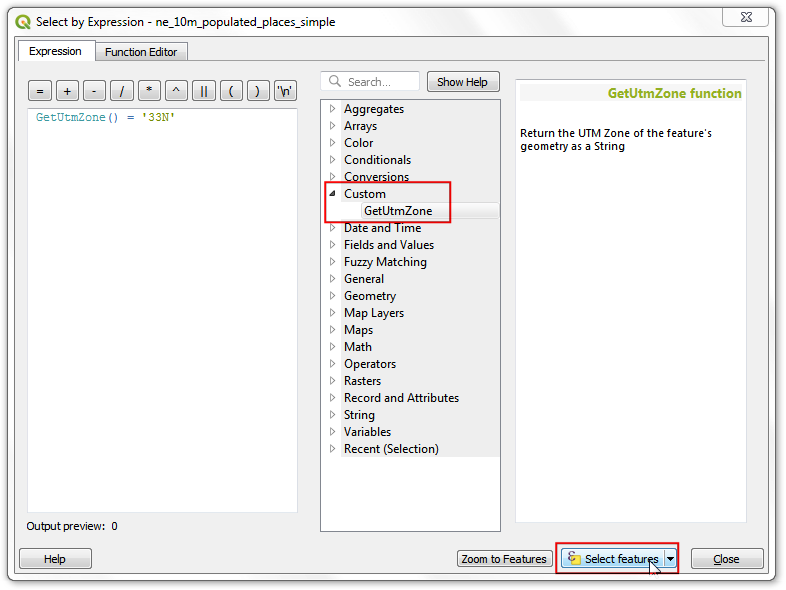
Switch to the Expression tab in the Select by expression dialog. Find and expand the Custom group in the Functions section. You will notice a new custom function
GetUtmZonein the list. We can now use this function in the expressions just like any other function. Type the following expression in the editor. This expression will select all points that fall in the UTM Zone33N. Click Zoom to Features and the map will change, if you click Select Features you should see the points in UTM zone 33N change colour to yellow.GetUtmZone() = '33N'
備註
Due to a bug, this feature did not work in earlier versions of QGIS 3. It has been fixed from version 3.4.5 onwards.
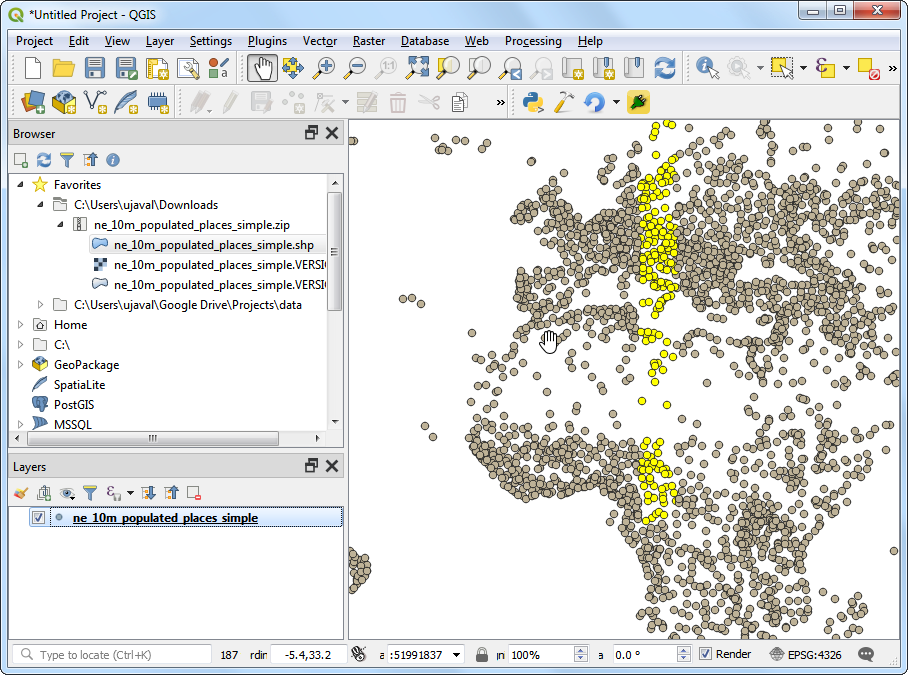
Back in the main QGIS window, you should see some points highlighted in yellow. These are the points falling in the UTM Zone we specified in the expression.
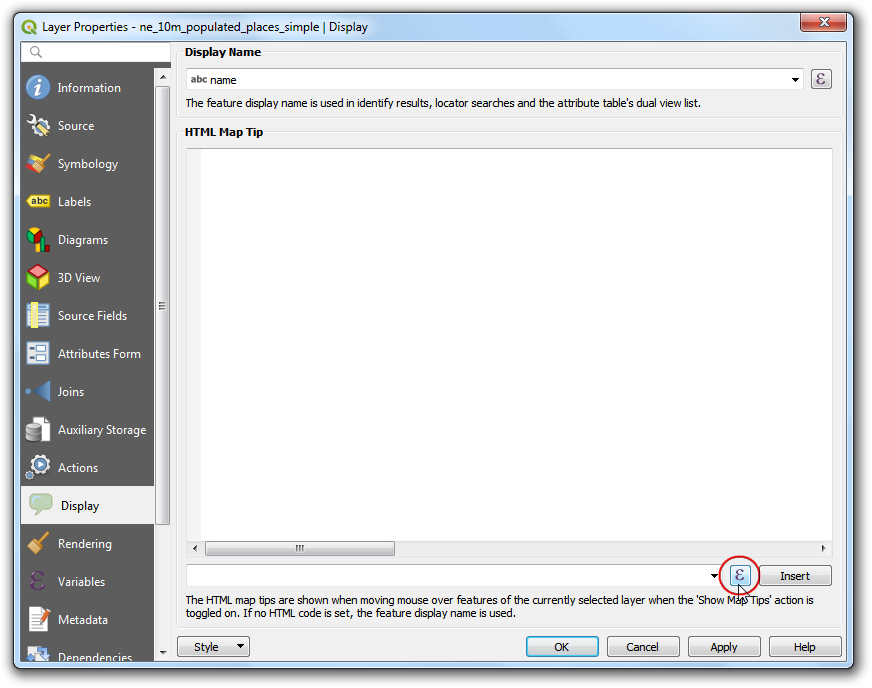
You saw how we defined and used a custom function to select features by expression. We will now use the same function in another context. One of the hidden gems in QGIS is the Map Tip tool. This tool shows user-defined text when you hover over a feature. Right-click the
ne_10m_populated_places_simplelayer and select Properties.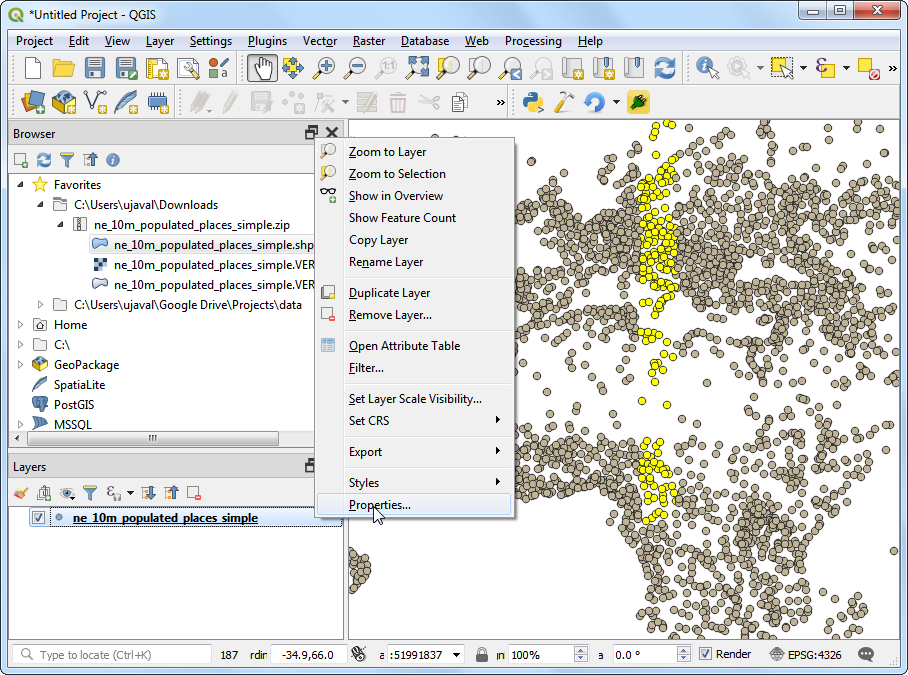
Switch to the Display tab. Here you can enter any text that will be displayed when you hover over the features of the layer. Even better, you can use layer field values and expressions to define a much more useful message. Click on the Ɛ button.
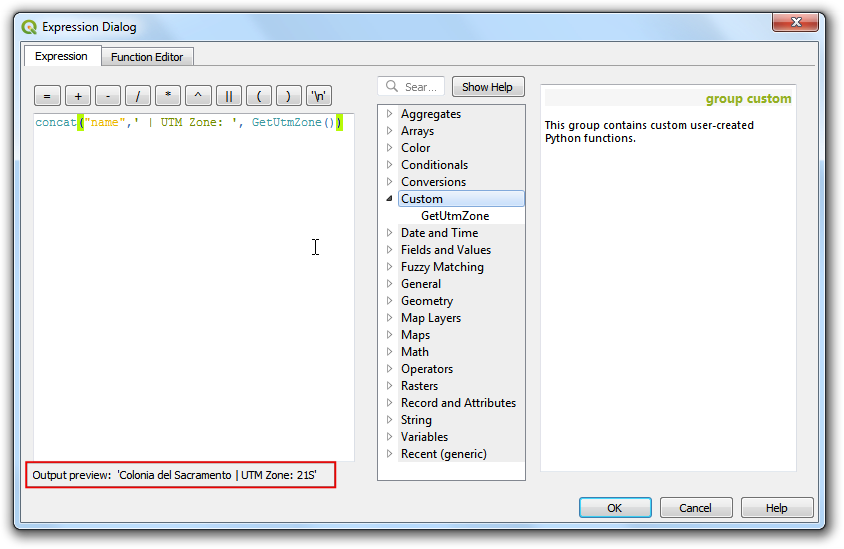
你會再次看到熟悉的表達式編輯器。我們要利用
concat函數來連接name屬性和GetUtmZone函數的輸出字串,因此輸入以下的表達式後,按下 確定。concat("name",' | UTM Zone: ', GetUtmZone())
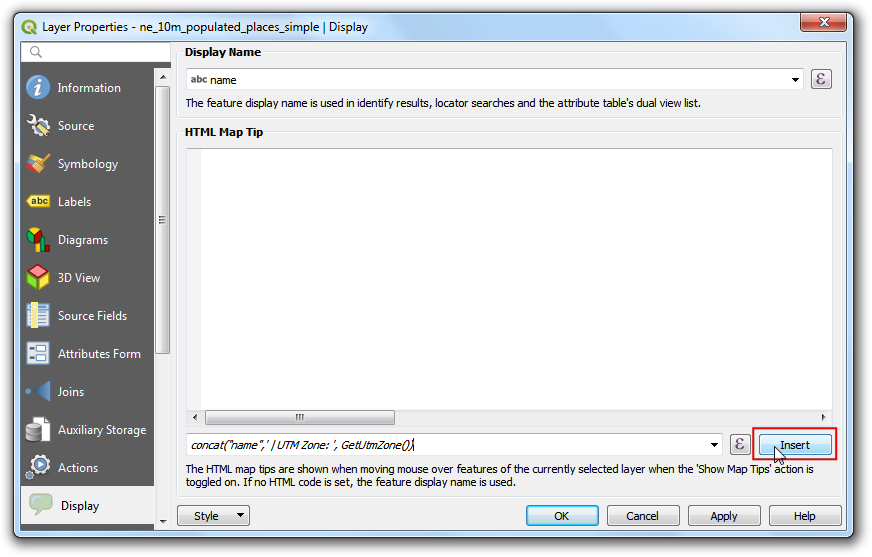
You will see the expression entered as the value of the Display text. Click Insert to add it to the HTML box and then press OK.
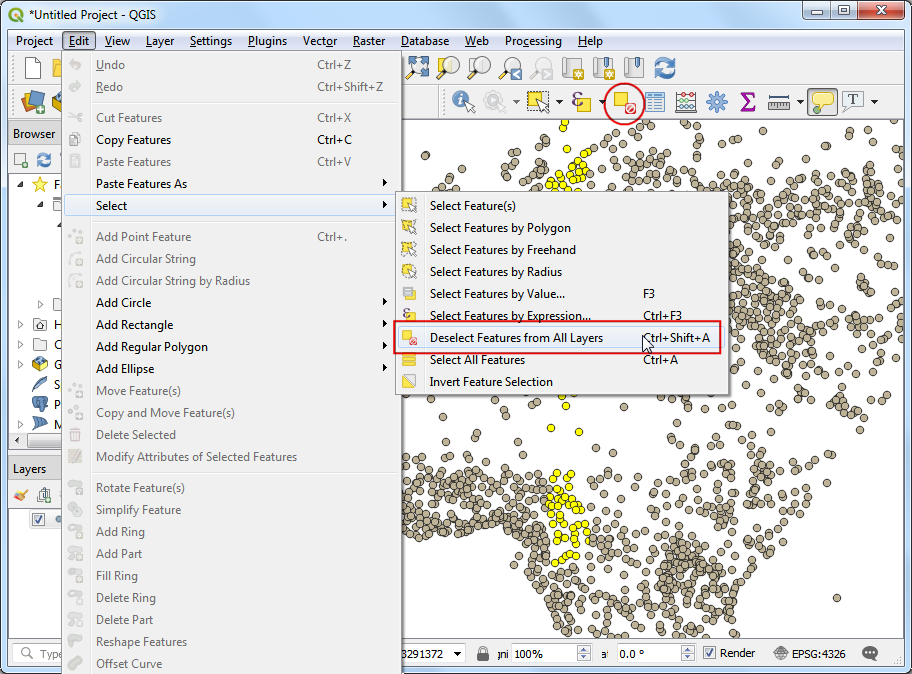
Before we proceed, let us de-select the features that were selected in the previous step. Go to or click the Deselect Features From All Layers button on the Attribute Toolbar.
Activate the
Map Tipstool by going to or clicking the Show Map Tips button on the Attributes Toolbar.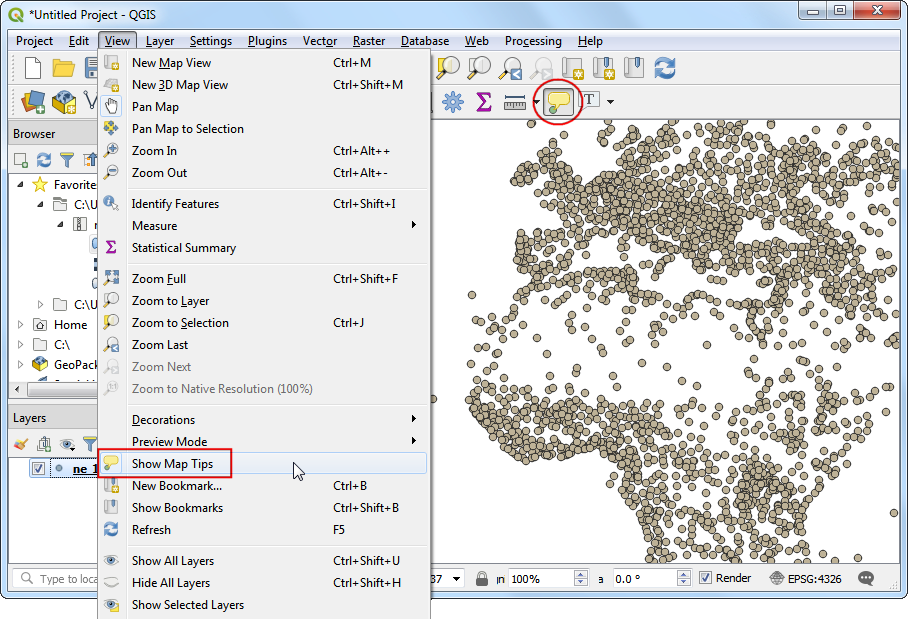
縮放至地圖的任一處然後把滑鼠游標放在任何圖徵上,你就會看到城市的名字和對應的 UTM 分區顯示在地圖提示之中。
If you want to give feedback or share your experience with this tutorial, please comment below. (requires GitHub account)