Using Custom Python Expression Functions
Opozorilo
A new version of this tutorial is available at Using Custom Python Expression Functions (QGIS3)
Expressions in QGIS have a lot of power and are used in many core features - selection, calculating field values, styling, labelling etc. QGIS also has support for user-defined expressions. With a little bit of python programming, you can define your own functions that can be used within the expression engine.
Overview of the task
We will define a custom function that finds the UTM Zone of a map feature and use this function to write an expression that displays the UTM zone as a map tip when hovered over the point.
Other skills you will learn
How to use the
Map Tipstool to display custom text when hovering over a feature.
Get the data
We will use Natural Earth’s Populated Places dataset. Download the simple (less columns) dataset
For convenience, you may directly download a copy of the dataset from the links below:
Procedure
Open QGIS and go to .
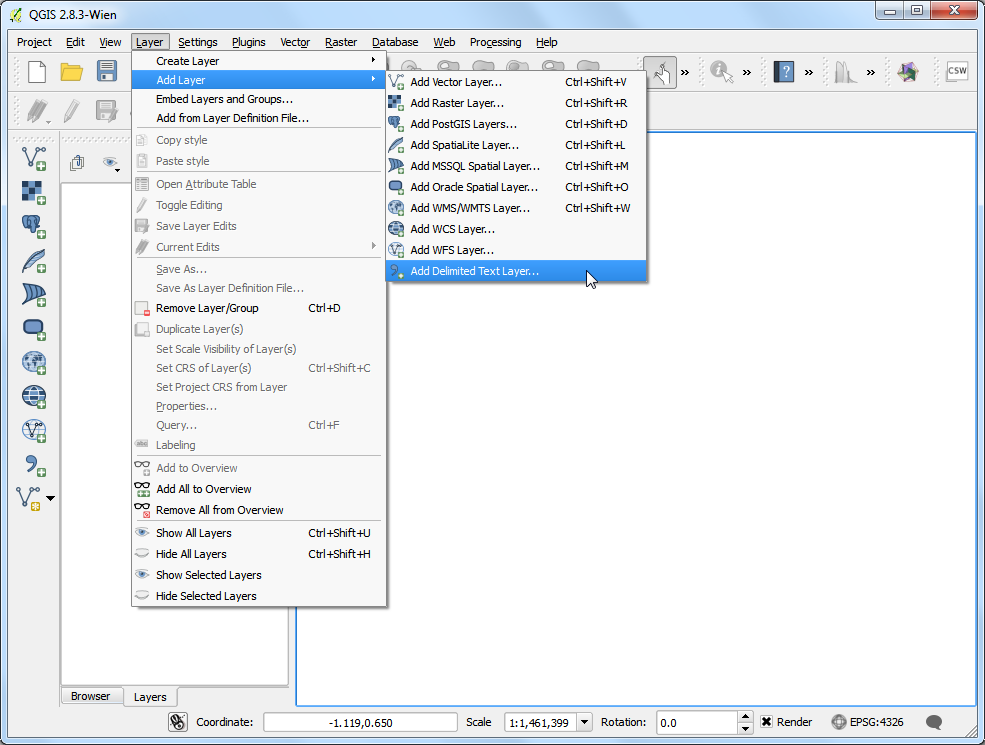
Browse to the downloaded
ne_10m_populated_places_simple.zipfile and click Open.
Go to .
Switch to the Function Editor tab. Here you can write any PyQGIS code that will be executed by the expression engine.
We will define a custom function named
GetUtmZonethat will calculate the UTM zone number for each feature. Since custom functions in QGIS work at the feature level. We will use the centroid of the feature’s geometry and compute the UTM Zone from the latitude and longitude of the centroid geometry. We will also add a ‚N‘ or ‚S‘ designation to the zone to indicate whether the zone is in the northern or southern hemisphere. Type the following code in the editor, enter the name of the file asutm_zones.pyand click Save file.
Opomba
UTM Zones are longitudinal projection zones numbered from 1 to 60. Each UTM zone is 6 degree wide. Here we use a simple mathematical formula to find the appropriate zone for a given longitude value. Note that this formula doesn’t cover some special UTM zones.
import math
from qgis.core import *
from qgis.gui import *

@qgsfunction(args=0, group='Custom', usesgeometry=True)
def GetUtmZone(value1, feature, parent):
    centroid = feature.geometry()
    longitude = centroid.asPoint().x()
    latitude = centroid.asPoint().y()
    zone_number = math.floor(((longitude + 180) / 6) % 60) + 1

    if latitude >= 0:
        zone_letter = 'N'
    else:
        zone_letter = 'S'

    return '%d%s' % (int(zone_number), zone_letter)
Click Run Script. This will execute the python code and register the function
GetUtmZonewith the expression engine. Note that this is needed to be done only once. Once the function is registered, it will always be available to the expression engine.
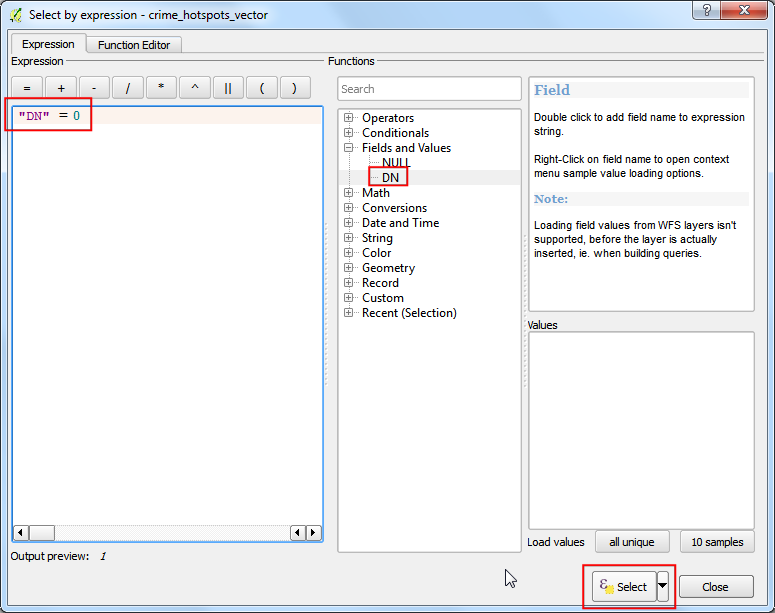
Switch to the Expression tab in the Select by expression dialog. Find and expand the Custom group in the Functions section. You will notice a new custom function
$GetUtmZonein the list. We can now use this function in the expressions just like any other function. Type the following expression in the editor. This expression will select all points that fall in the UTM Zone40N. Click Select.
$GetUtmZone = '40N'
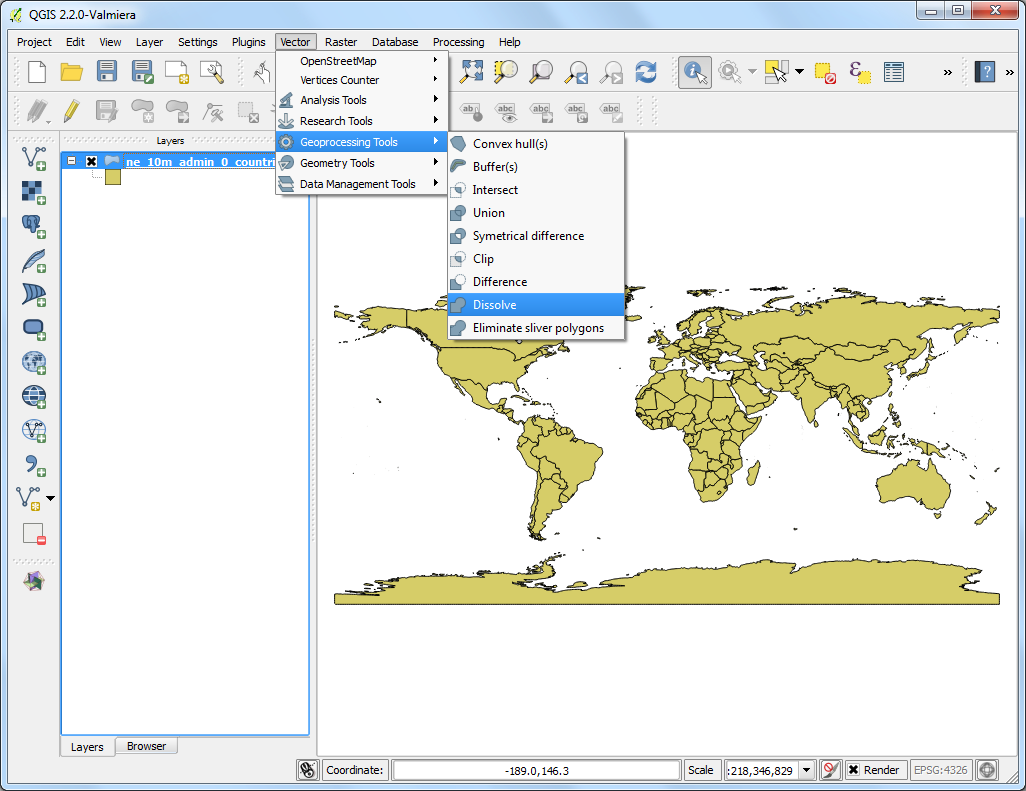
Back in the main QGIS window, you will see many points highlighted in yellow. These are the points falling in the UTM Zone we specified in the expression.
You saw how we defined and used a custom function to select features by expression. We will now use the same function in another context. One of the hidden gems in QGIS is the
Map Tiptool. This tool shows user-defined text when you hover over a feature. Right-click thene_10m_populated_places_simplelayer and select Properties.
Switch to the Display tab and select HTML. Here you can enter any text that will be displayed when you hover over the features of the layer. Even better, you can use layer field values and expressions to define a much more useful message. Click on the Insert expression… button.
You will see the familiar expression editor again. We will use the
concatfunction to join the value of the fieldnameand the result of our custom function $GetUtmZone. Enter the following expression and click OK.
concat("name", ' | UTM Zone: ', $GetUtmZone)
You will see the expression entered as the value of the Display text. Click OK.
Before we proceed, let us de-select the features that were selected in the previous step. Go to .
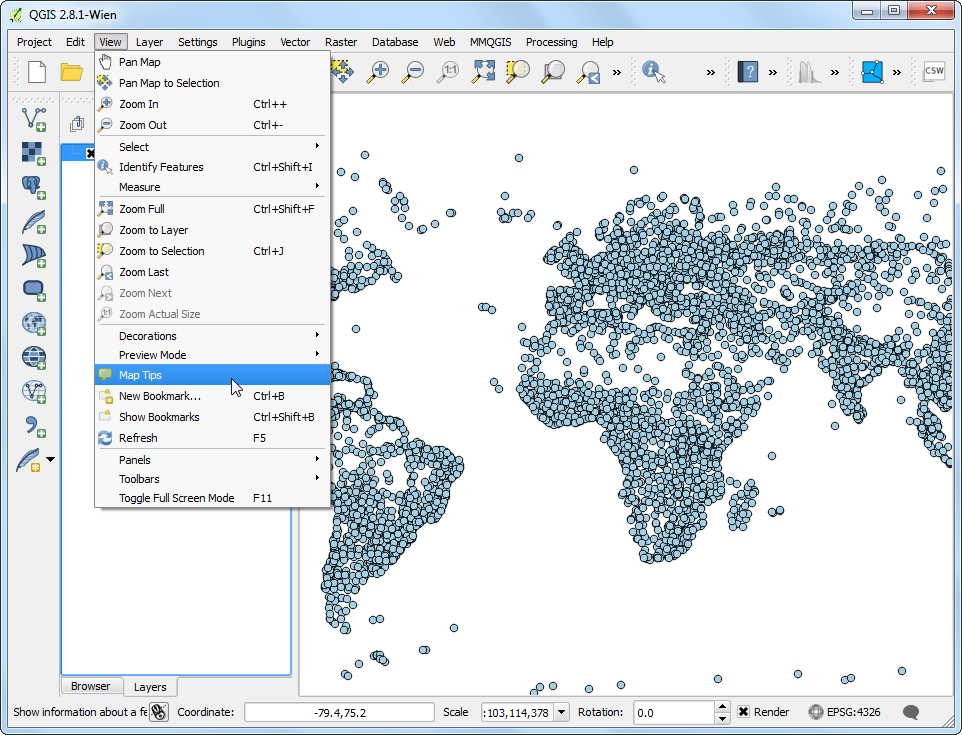
Activate the
Map Tipstool by going to .
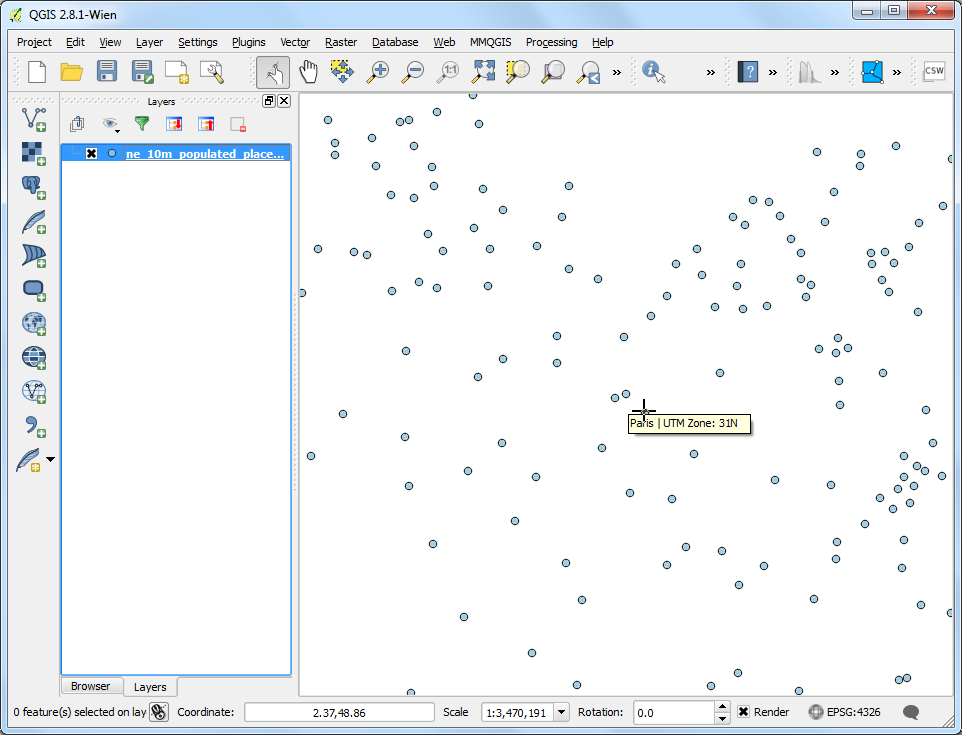
Zoom into any area of the map and put your mouse cursor over any feature. You will see the name of the city and corresponding UTM zone displayed as the map tip.
If you want to give feedback or share your experience with this tutorial, please comment below. (requires GitHub account)