Ujaval Gandhi
Creating Basemaps with QTiles
Tiles have revolutionized the idea of web mapping and has given us fast and easy access to large datasets. Tiling schemes divide the World into small tiles (typically 256 x 256 pixels) for each zoom level and pre-render datasets to these tiles. This way only a small fraction of a large dataset is served to the user at any given time - resulting in a map that can be zoomed or panned with ease over the internet. There are many methods to create tiles from GIS datasets. One easy way to create tiles from your QGIS project is a plugin called QTiles. In this tutorial, you will learn how to create PNG tiles from any set of layers loaded in QGIS and create a basemap to be used in a web mapping project.
Overview of the task
We will create tiles from the Natural Earth raster covering the entire planet.
Get the data
We will use the Natural Earth 2 dataset from Natural Earth.
Download the medium-size Natural Earth II with Shaded Relief, Water, and Drainages zip file.
Data Source [NATURALEARTH]
Procedure
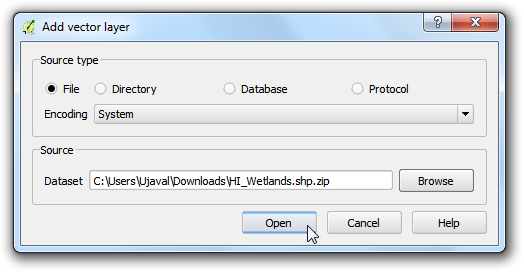
Unzip the downloaded
NE2_LR_LC_SR_W.zipfile to a folder on your computer. Open QGIS and go to . Browse to the location of the extracted files and selectNE2_LR_LC_SR_W.tif. Click OK.
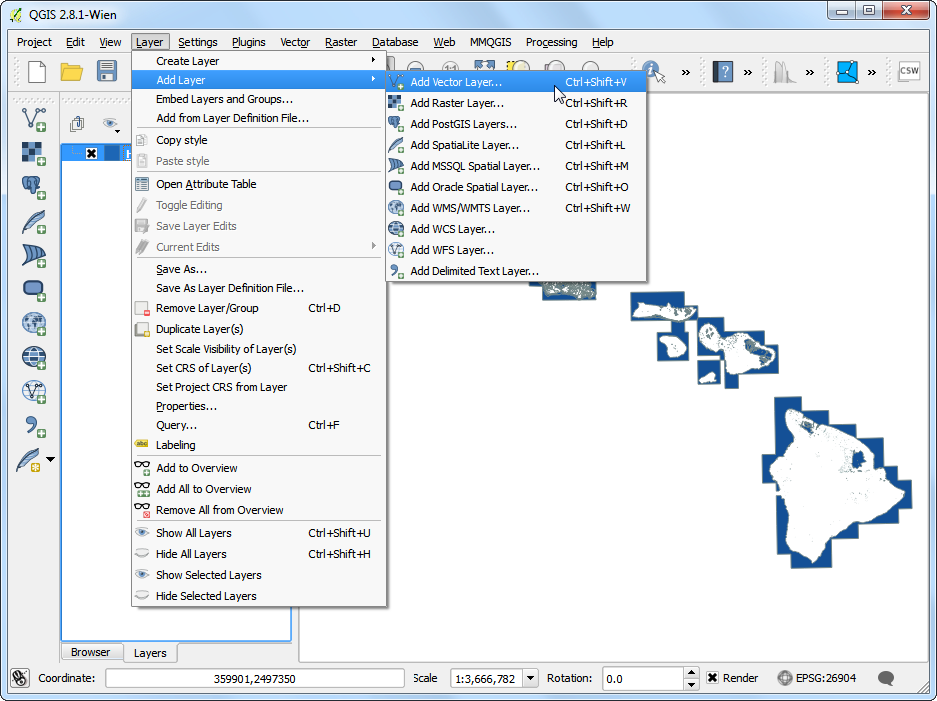
Install the
QTilesplugin by going to . Note that the plugin is currently marked experimental, so you will need to check Show also experimental plugins in Plugin Settings. (See Using Plugins for more details on installing plugins in QGIS). Once the plugin is installed, go to .
In the QTiles dialog, select Directory as the Output and browse to a folder of your choice where the output tiles will be created. Choose Layer extent of the
NE2_LR_LC_SR_Wlayer as the extent of the tiles. Set the Maximum Zoom to6. Expand the Parameters section and check the Write Leaflet-based viewer. Click Run to start the process of rendering the tiles.
Opomba
The number of tiles increase 4 times for every additional zoom level and since our layer has an extend of the entire World - there will be millions of tiles at higher zoom levels.
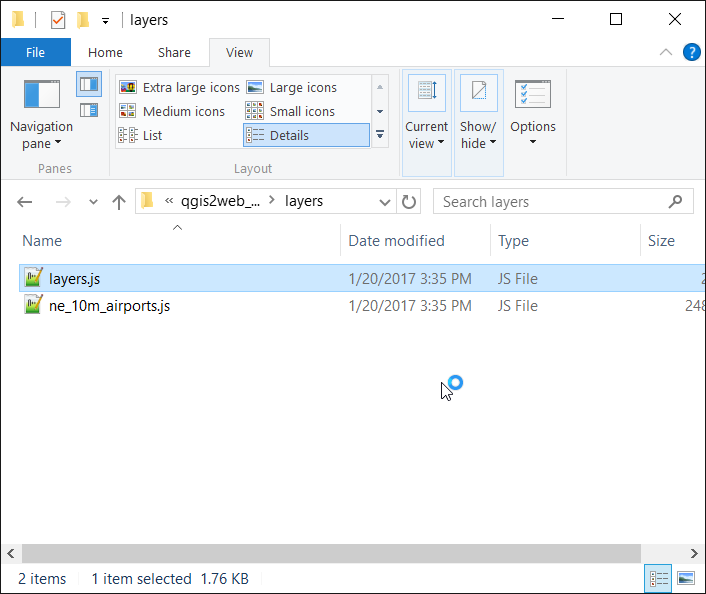
Once the process finishes, close the QTiles dialog and browse to the output folder you had selected. You will notice folders for each zoom level upto the maximum zoom level. Each folder further contains subfolder for X coordinates and then the actual tiles named for Y coordinates.
In the parent directory of top-level tiles directory, you will find a
QTiles.htmlfile. This is a simple viewer to explore the tiles using the Leaflet web mapping library.
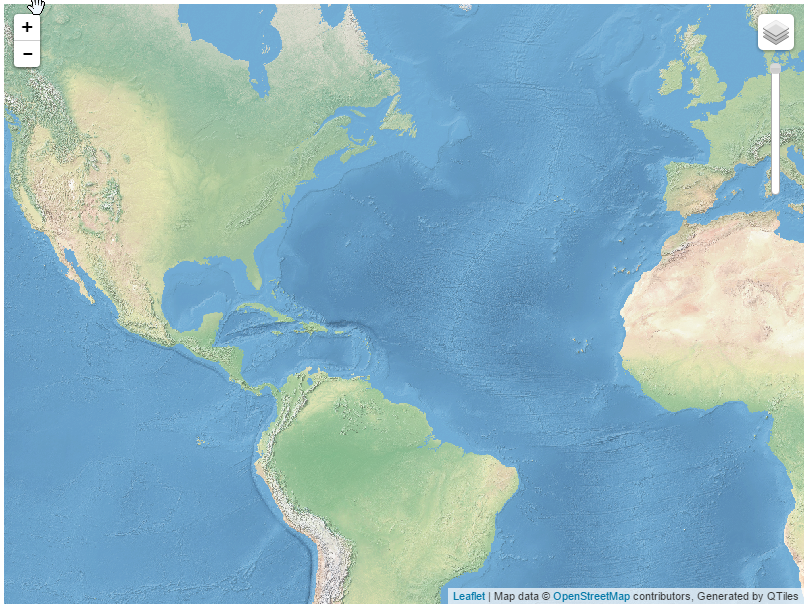
Double-click the
QTiles.htmlto open it in a web browser. You can zoom and pan around to see the tiles seamlessly form the original raster layer.
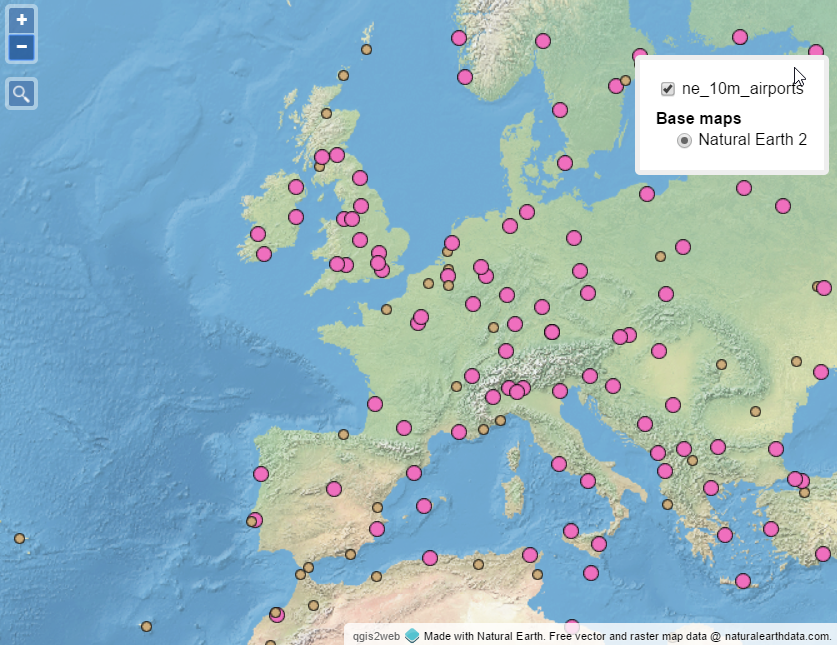
You can use these tiles with any web-mapping library that supports XYZ tiling schemes and overlay other layers on top. To demonstrate the usefulness and portability of such tiles, we will now add the tiles created in this tutorial as the basemap for the airports map created in Web Mapping with QGIS2Web tutorial. In that tutorial, we chose to use a ready-made basemap from OpenStreetMap. We can easily swap that with our own custom basemap created in this tutorial. Go to the output directory where the qgis2web map was exported. Open the file created during the export.
Locate the code block where the
OSM B & Wbase layer is defined.
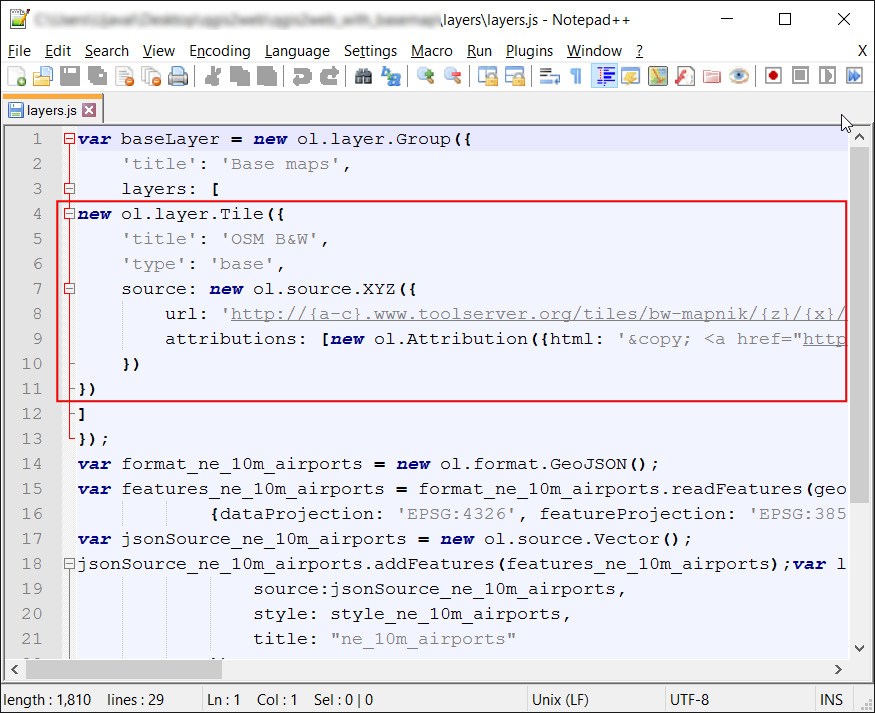
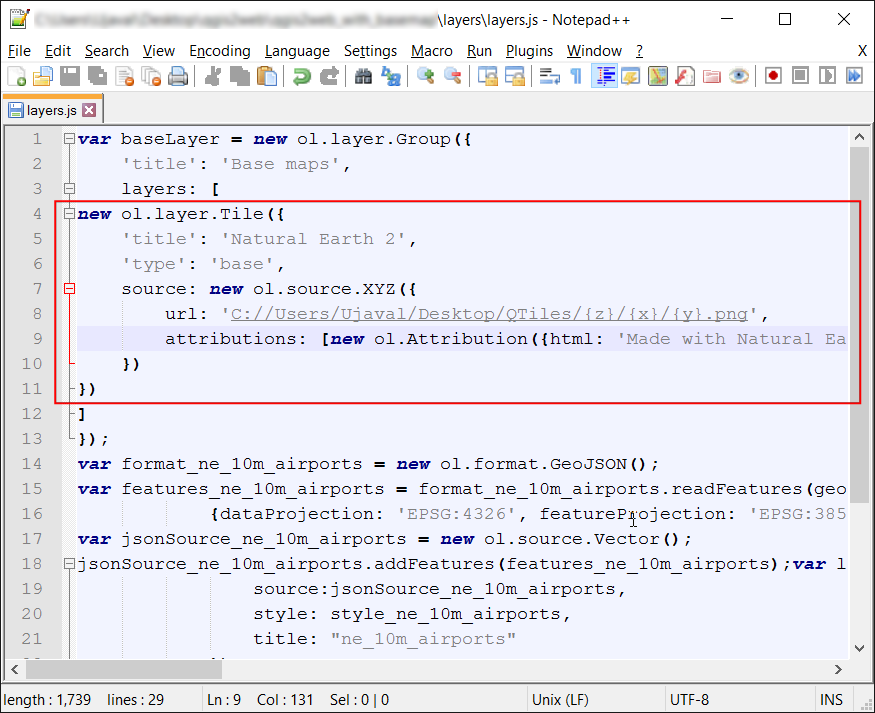
Replace the definition of the base layer with our own tiles. At this point, the tiles exist only on your computer, so the URL will be the local directory. But you can also upload the tiles to a server and give the URL of the server. Change the title and source with appropriate values for Natural Earth. Save the file.
new ol.layer.Tile({
 'title': 'Natural Earth 2',
 'type': 'base',
 source: new ol.source.XYZ({
     url: 'C://Users/Ujaval/Desktop/QTiles/{z}/{x}/{y}.png',
     attributions: [new ol.Attribution({html: 'Made with Natural Earth. Free vector and raster map data @ naturalearthdata.com.'})]
 })
})
Open the web map in a browser and you will see that the B & W OSM layer is replaced by our freshly created tiles.