 Ujaval Gandhi
Working with Terrain Data (QGIS3)
Terrain or elevation data is useful for many GIS analyses, and it is often used in maps. QGIS3 has good terrain processing capabilities built-in. In this tutorial, we will work through the steps to generate various products from elevation data such as hillshade and contour.
Overview of the task
The task is to create contours and a hillshade map for area around Mt. Everest.
Other skills you will learn
Searching and downloading freely available terrain data.
Exporting a vector layer as KML and viewing it in Google Earth.
Smoothing of contour lines.
Get the data
We will be working with GMTED2010 dataset from USGS. GMTED (Global Multi-resolution Terrain Elevation Data) is a global terrain dataset that is the newer version of GTOPO30 dataset.
Here is how to search and download the revelant data from USGS Earthexplorer.
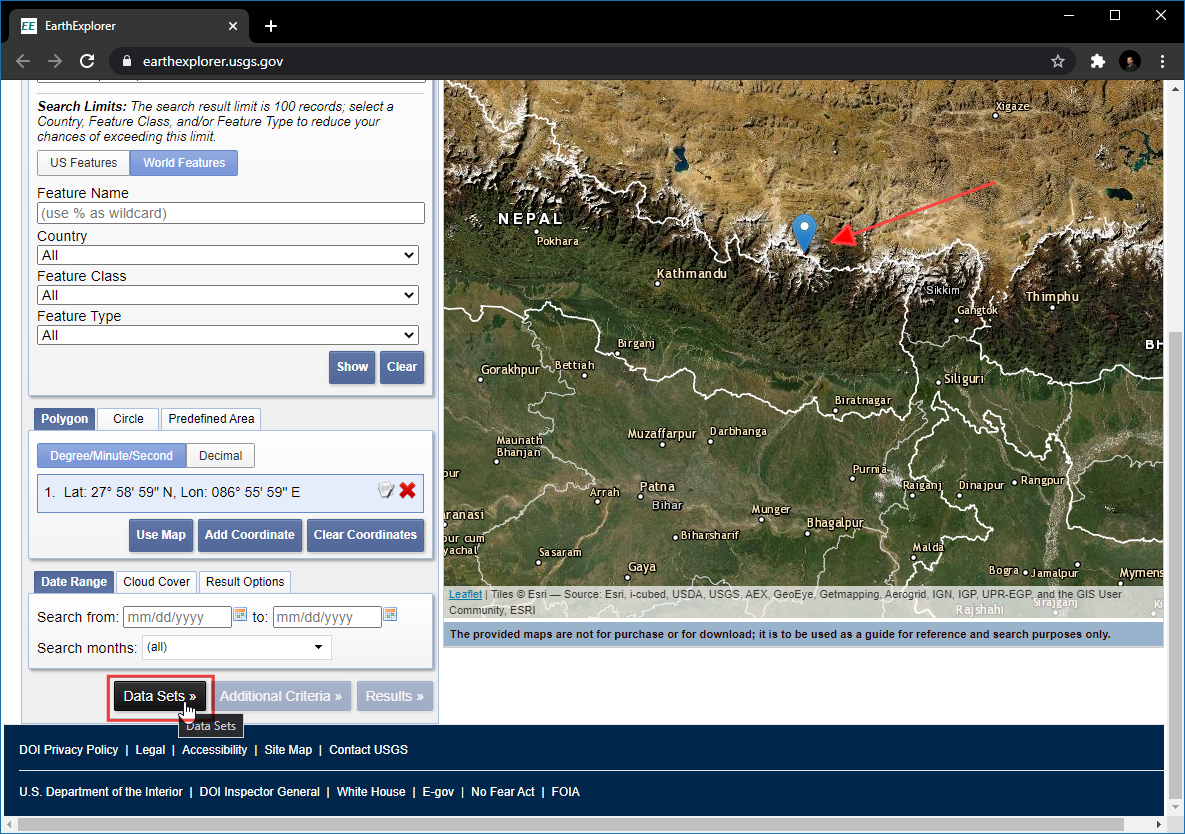
Go to the USGS Earthexplorer . Search Criteria tab, select the Decimal option under Polygon. Click the Add Coordinate button.
In the pop-up window, enter the Latitude as 27.98942 and Longitude as 86.92533 and click Add. A new marker will be added at the location of Mt.Everest. Click on Data Sets.
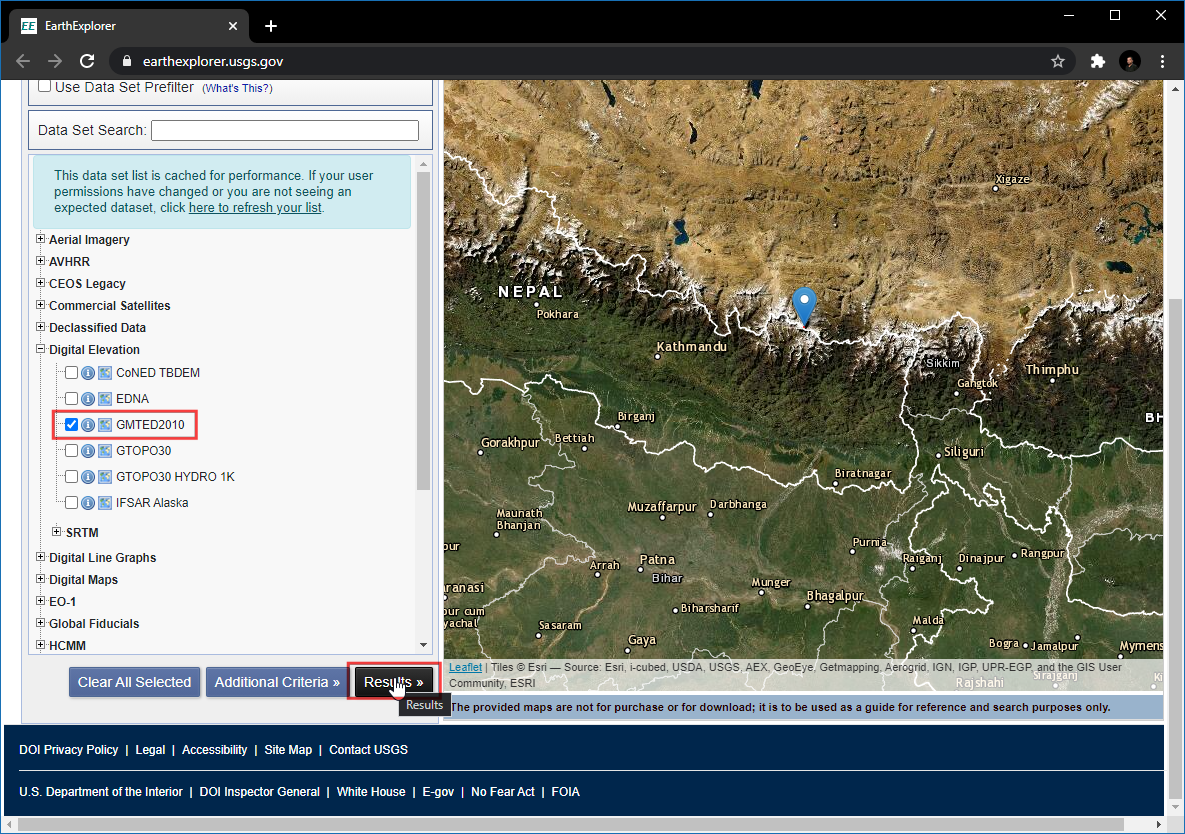
Expand the Digital Elevation group, and check GMTED2010. Click on Results.
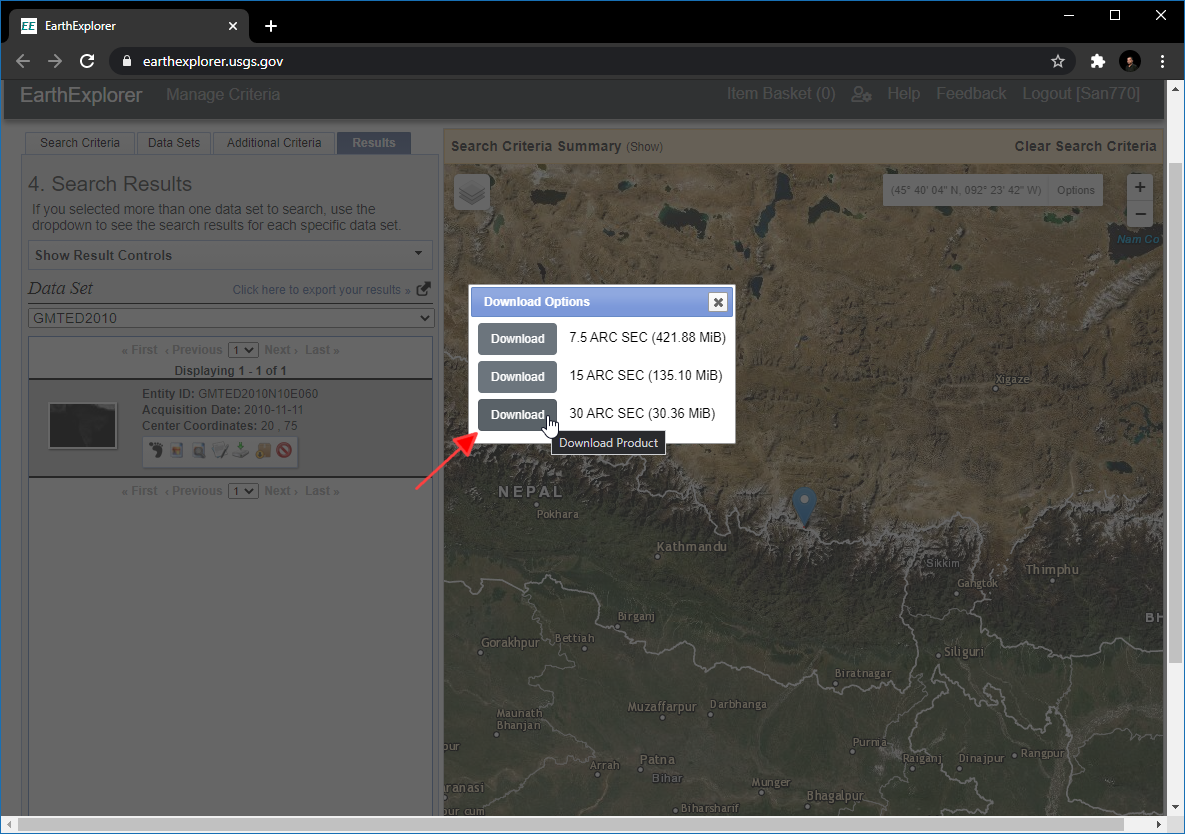
Click the Download Options button.
Warning
You will have to log in to the site at this point. You can create a free account if you do not have one.
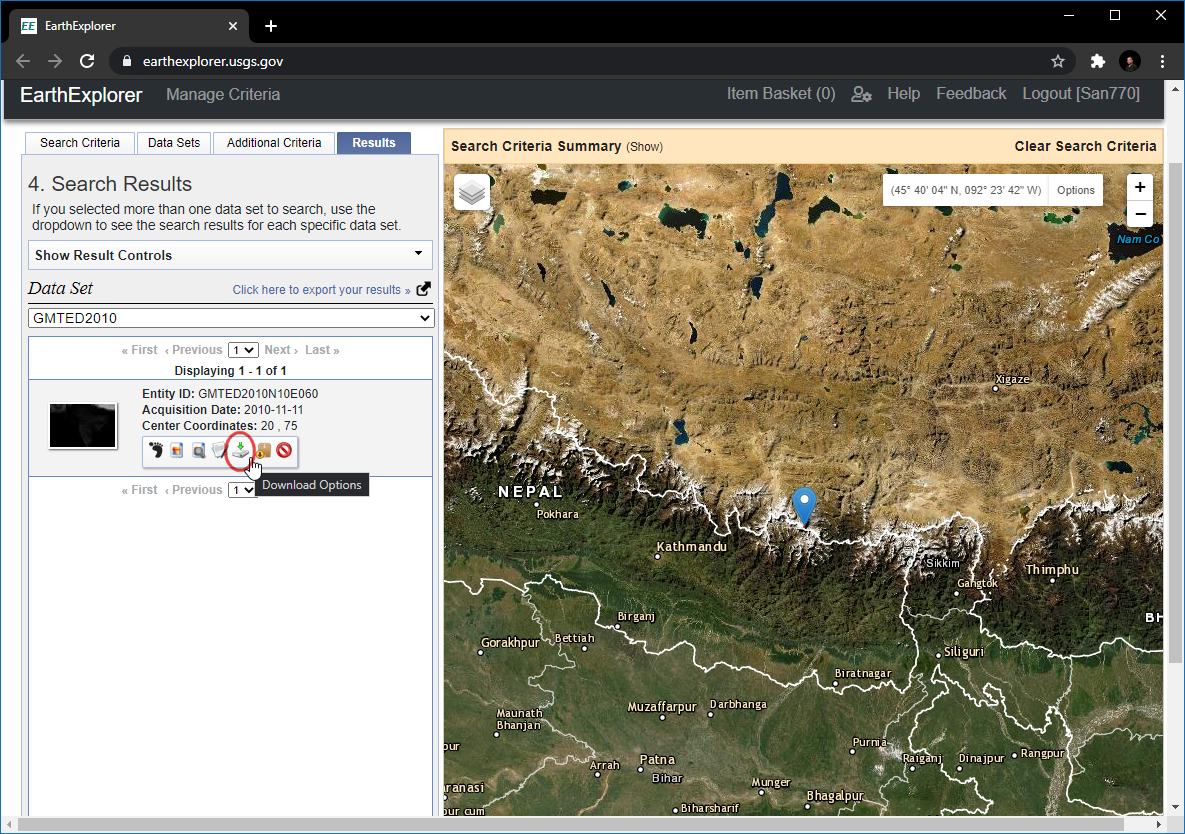
Select the 30 ARC SEC option and click Download.
You will now have a file named GMTED2010N10E060_300.zip. Elevation data is distributed in various raster formats such as ASC, BIL, GeoTiff, etc. QGIS supports a wide variety of raster formats via the GDAL library. The GMTED data comes as GeoTiff files which are contained in this zip archive.
For convenience, you can download a copy of the data directly from below.
Data Source: [GMTED2010]
Procedure
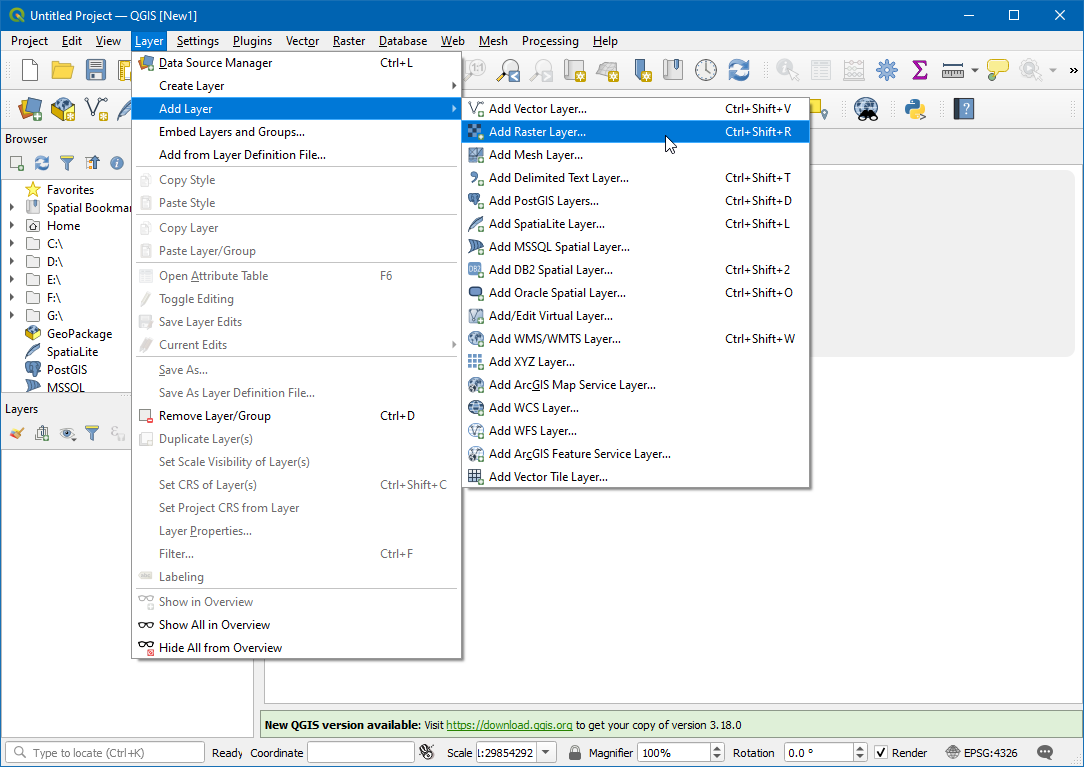
Open .
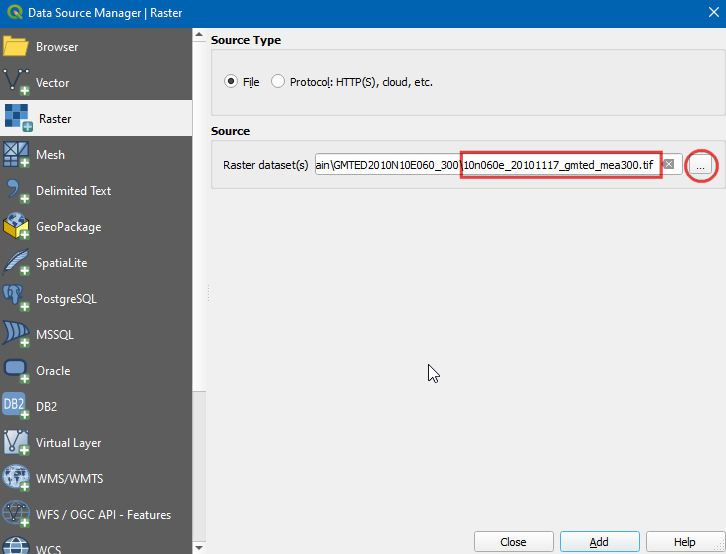
Click on the … under Source, search and select the file named 10n060e_20101117_gmted_mea300.tif.
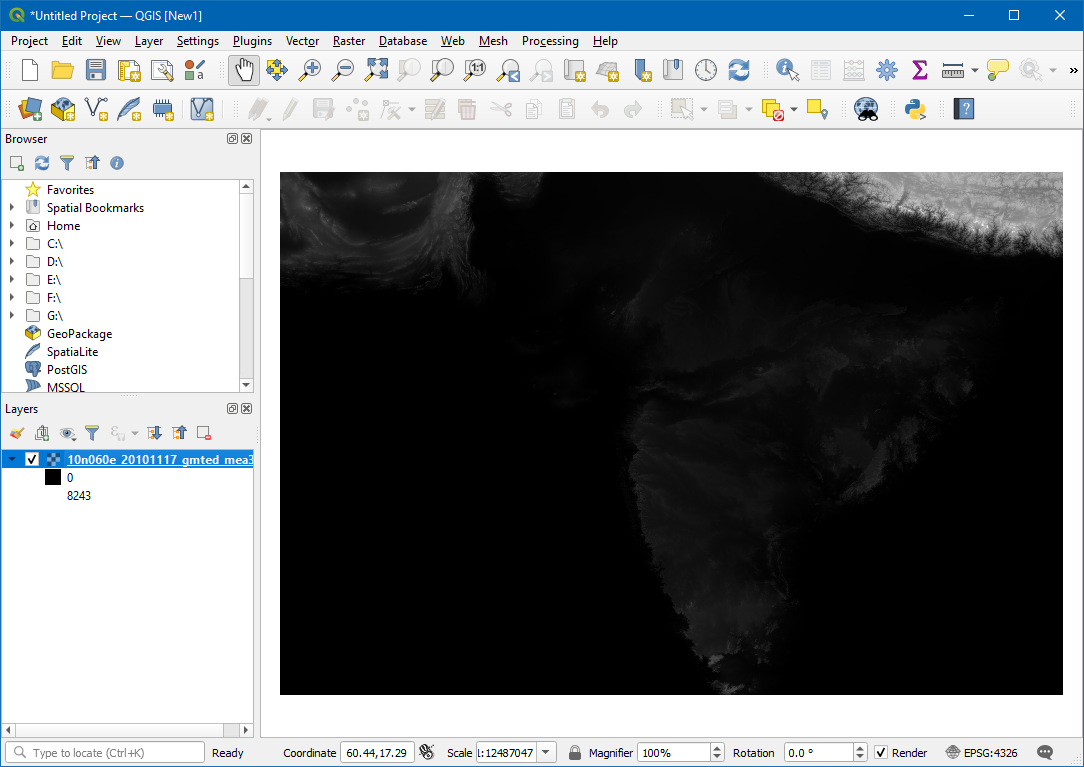
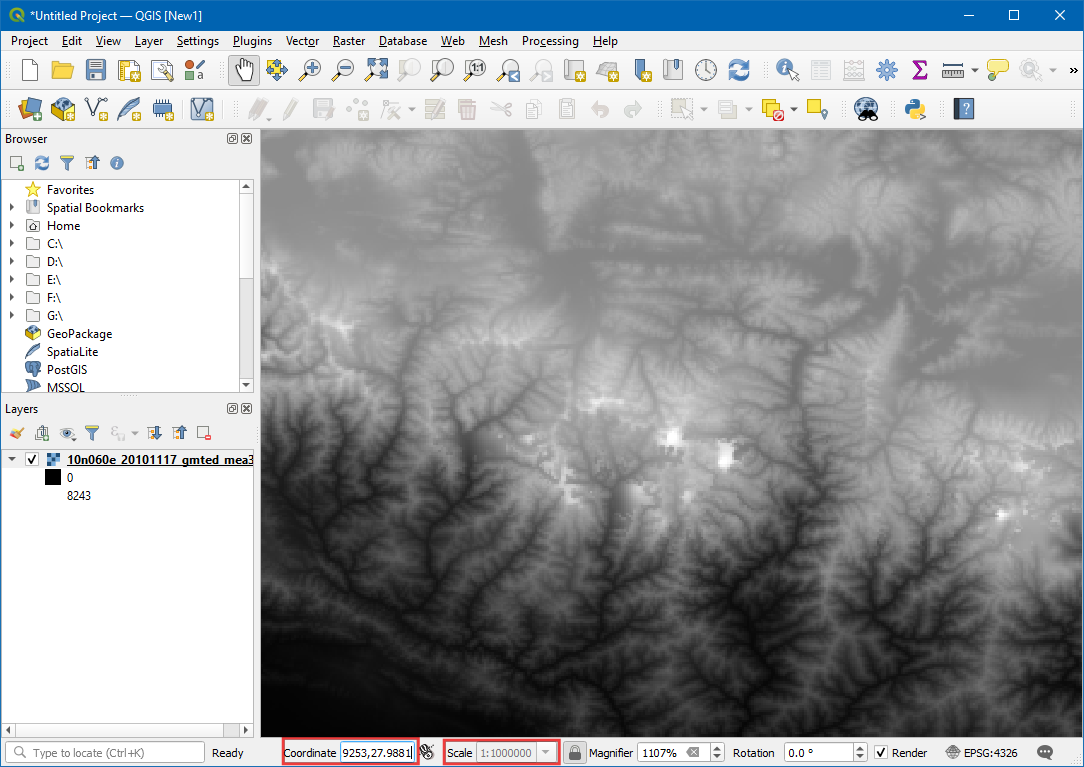
You will see the terrain data rendered in the QGIS Canvas. Each pixel in the terrain raster represents the average elevation in meters at that location. The dark pixels represent areas with low altitude and lighter pixels represent areas with high altitude.
Let’s find our area of interest. From Wikipedia, we find that the coordinates for our area of interest - Mt. Everest - is located at the coordinates 27.9881° N, 86.9253° E. Note that QGIS uses the coordinates in (latitude, longitude) format when the CRS is set to EPSG:4326. Therefore, paste the value 27.9881, 86.9253 these at the bottom of the QGIS window where it says Coordinate and press guilabel:Enter. The viewport will be centered at this coordinate. To zoom in, Enter 1:1000000 in the Scale field and press Enter. You will see the viewport zoom to the area around the Himalayas.
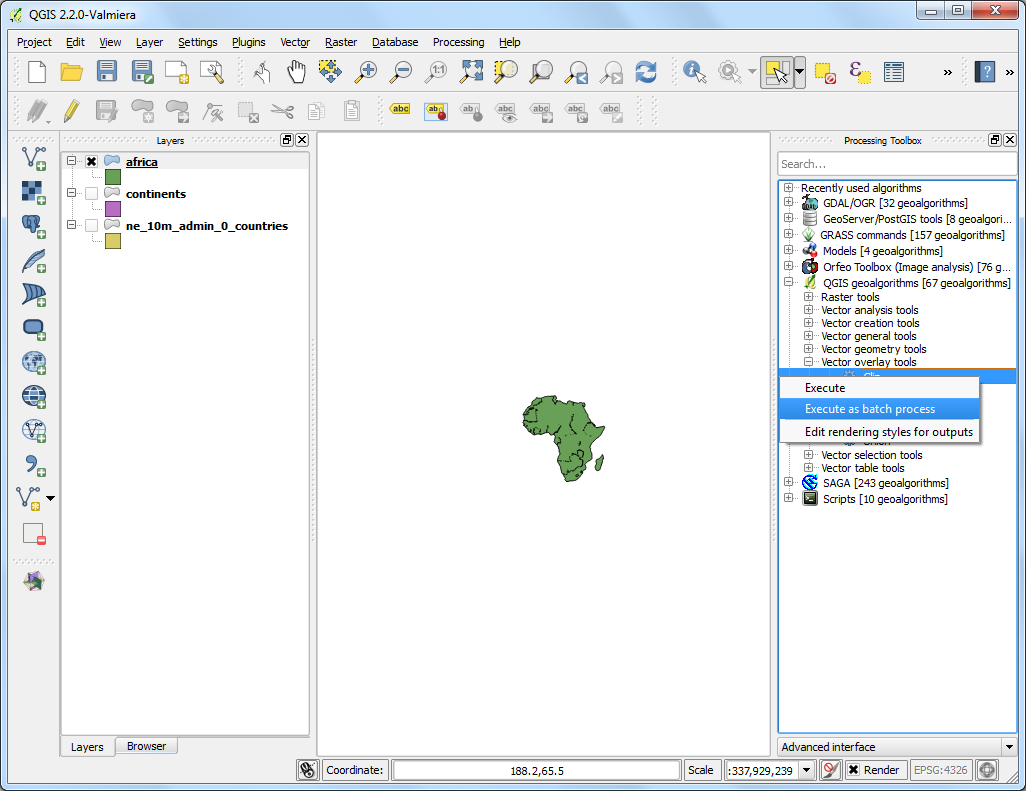
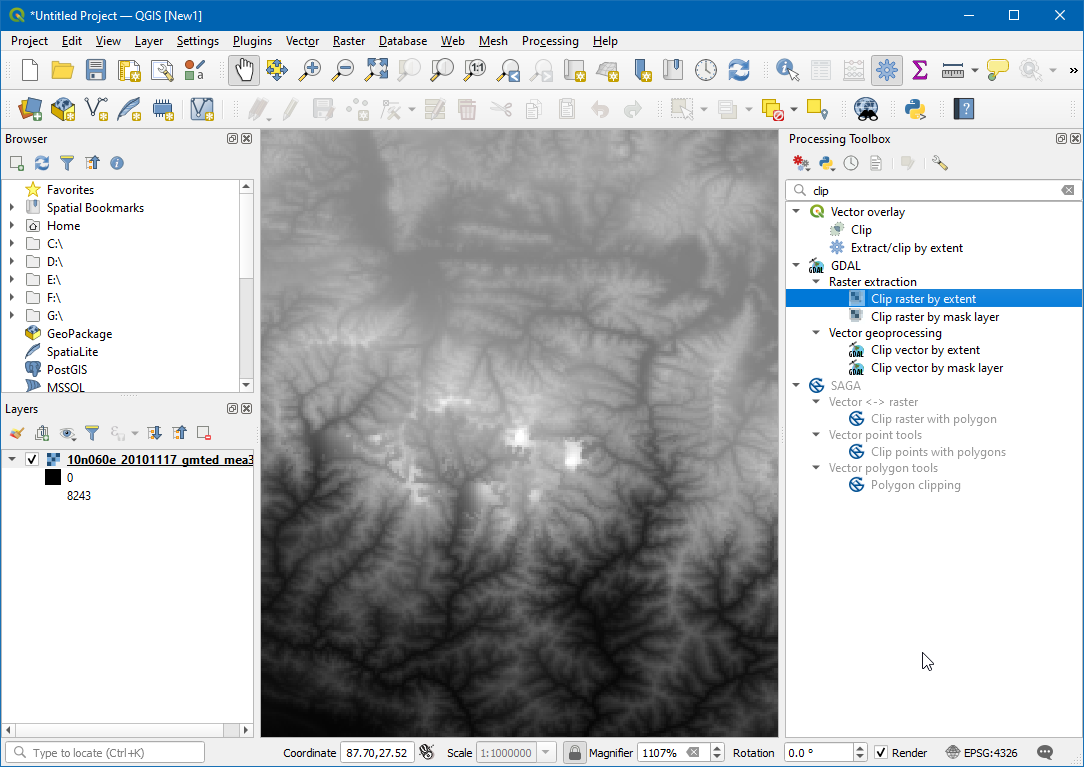
We will now crop the raster to this area of interest. Search for Clip in Processing Toolbox. Select the
Clip Raster by extentunder GDAL algorithms.
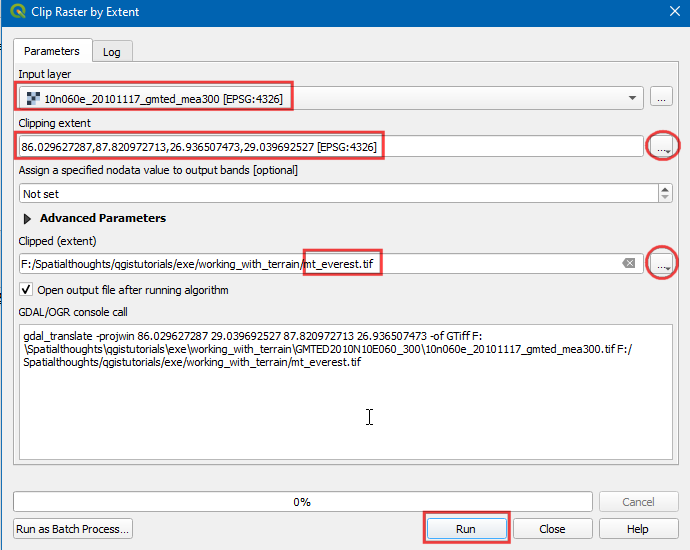
In the Clip Raster by Extent window, select
10n060e_20101117_gmted_mea300as Input Layer, click...in Clipping extent and selectUse Map canvas extent, click...in Clipped (extent) and enter the name asmt_everest.tif. Click Run.
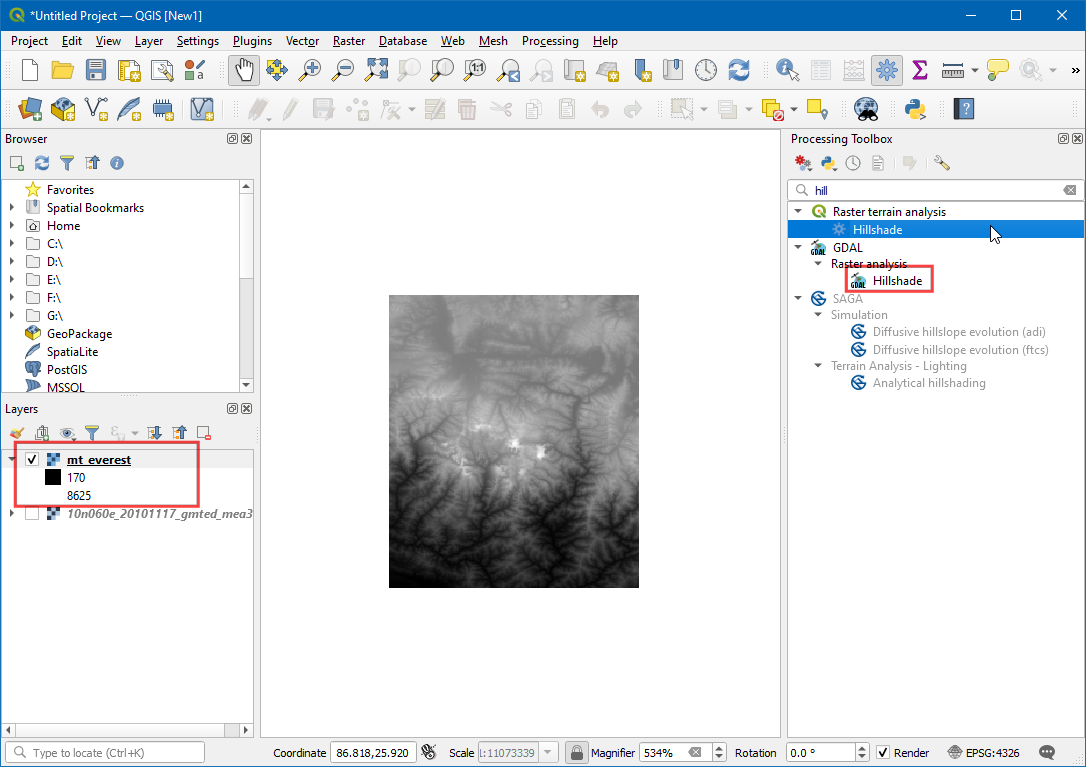
A new layer
mt_everestwill appear in the canvas. Search for Hill in Processing Toolbox. Select theHillshadealgorithm under GDAL algorithms.
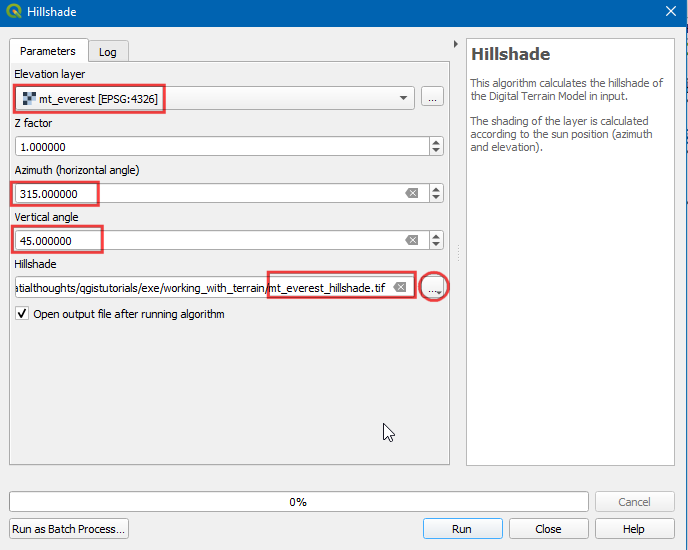
In the Hillshade window, select
mt_everestas Elevation Layer, enter315.000in Azimuth (horizontal angle), enter45.000in Vertical angle. Click...in Hillshade and enter the name asmt_everest_hillshade.tif. Click Run.
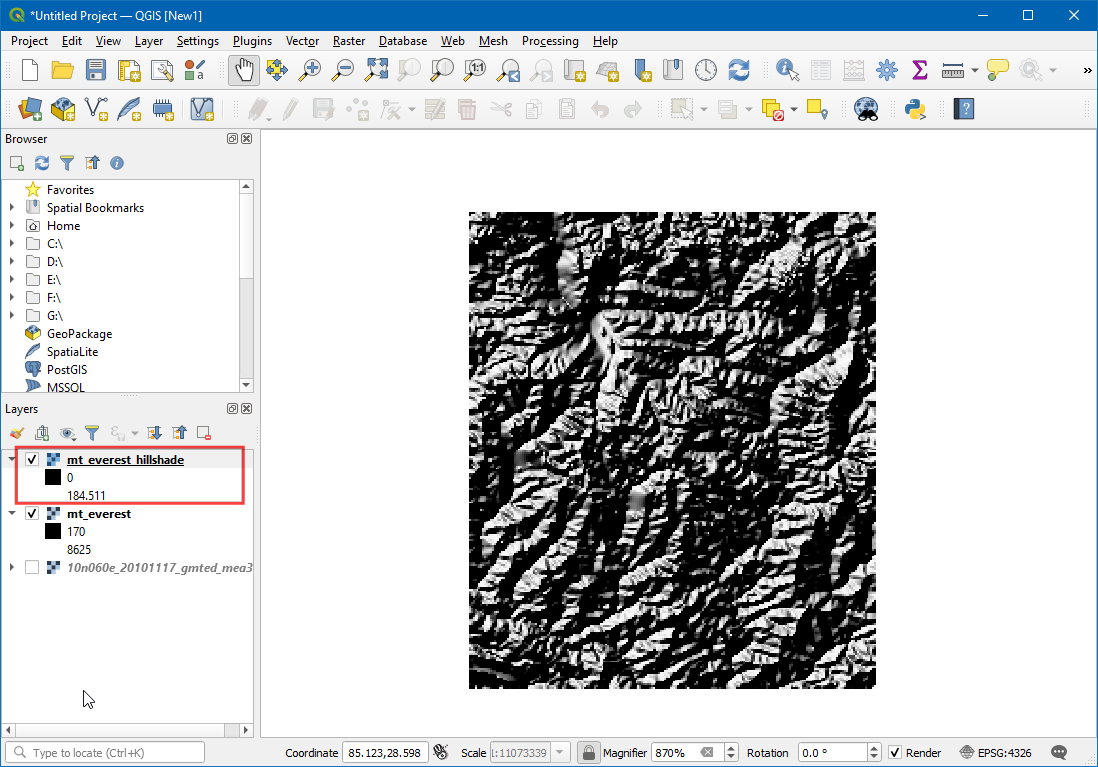
A new layer
mt_everest_hillshadewill appear in the canvas.
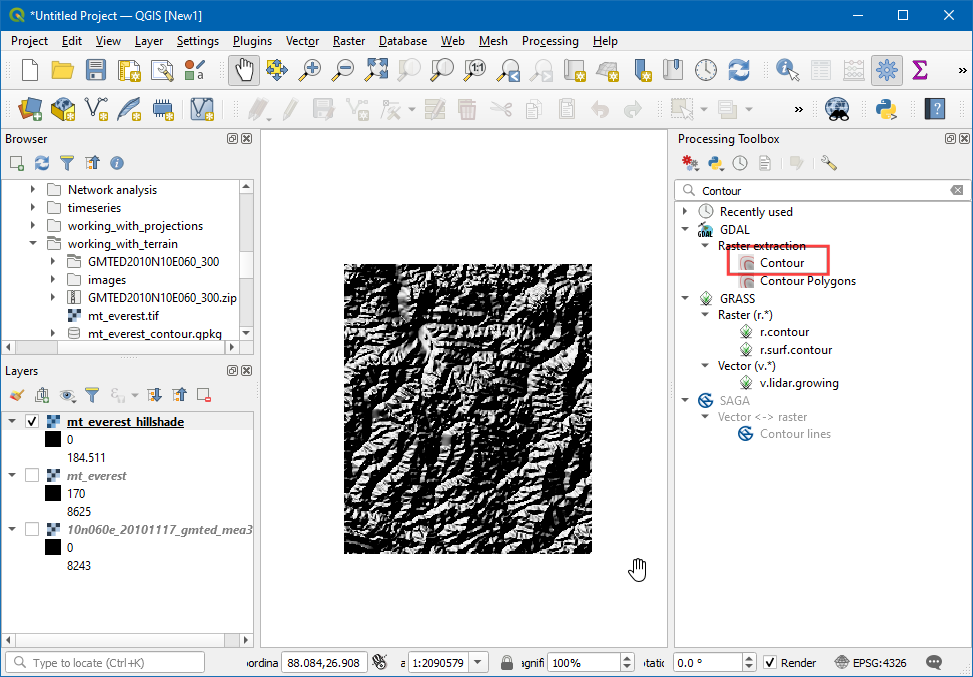
Search for Contour in Processing Toolbox. Select the
Contouralgorithm under GDAL algorithms.
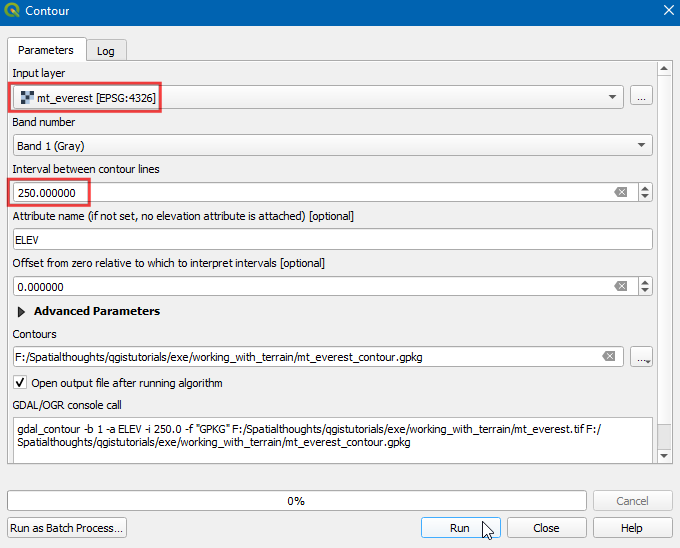
In the Contour window, select
mt_everestas Input Layer, enter250in Interval between contour lines. Click...in Contours and enter the name asmt_everest_contour.gpkg. Click Run.
A new layer
mt_everest_contourwill appear in the canvas. Right-click on the layer and click Open Attribute Table.
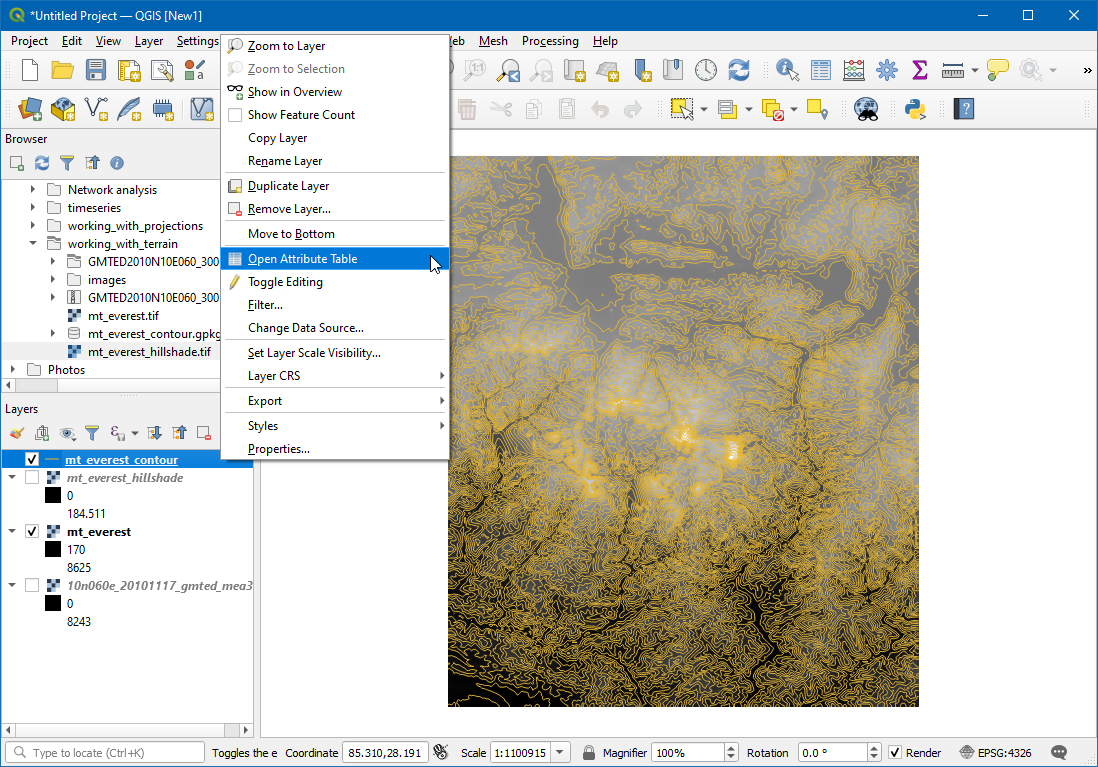
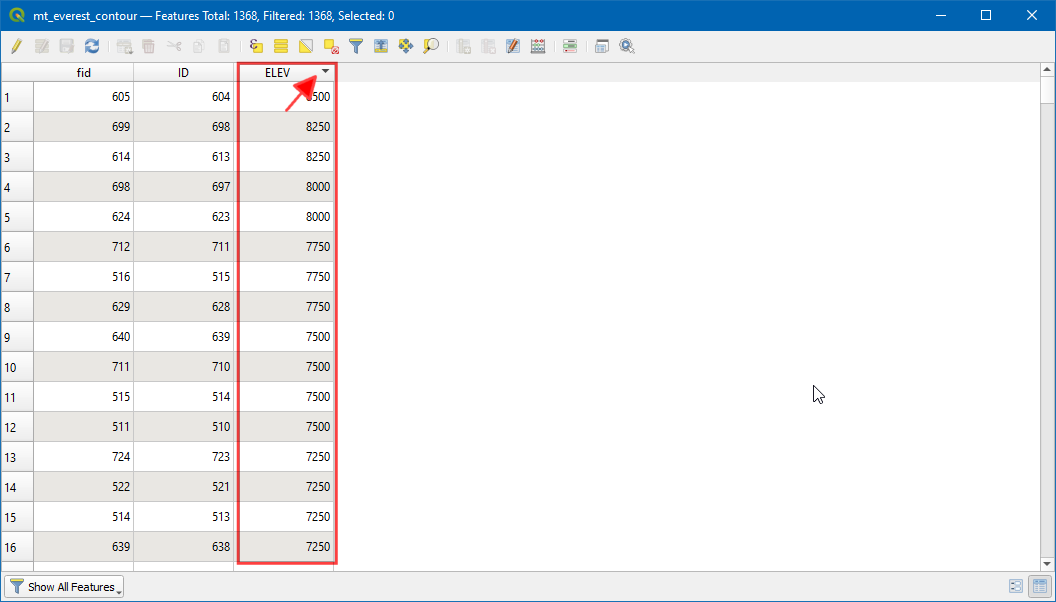
You will see that each line feature has an attribute named ELEV. This is the height in meters that each line represents. Click on the column header a couple of times to sort the values in descending order. Here you will find the line representing the highest elevation in our data, i.e. Mt. Everest.
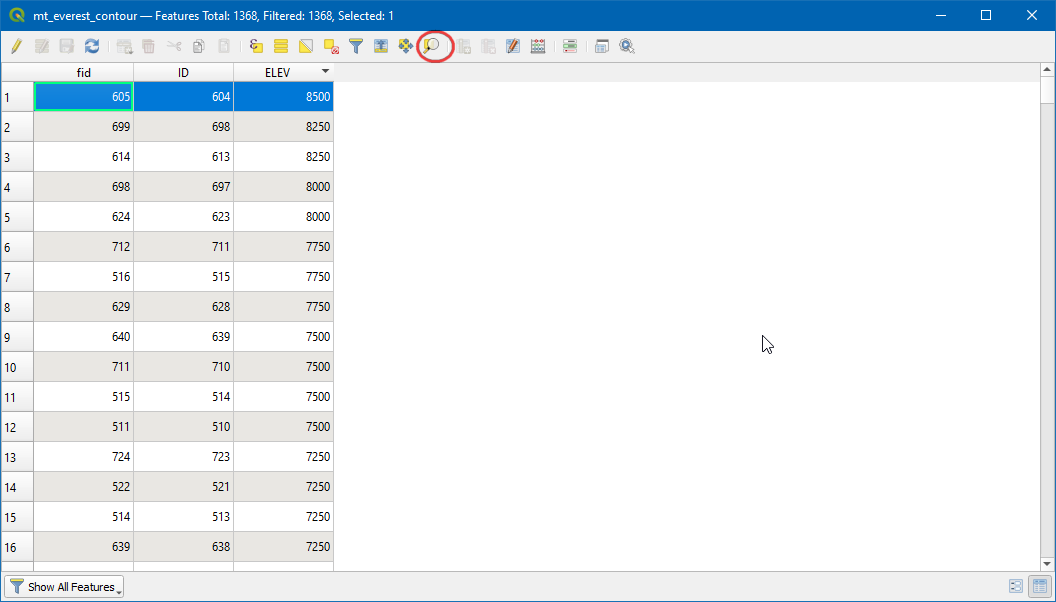
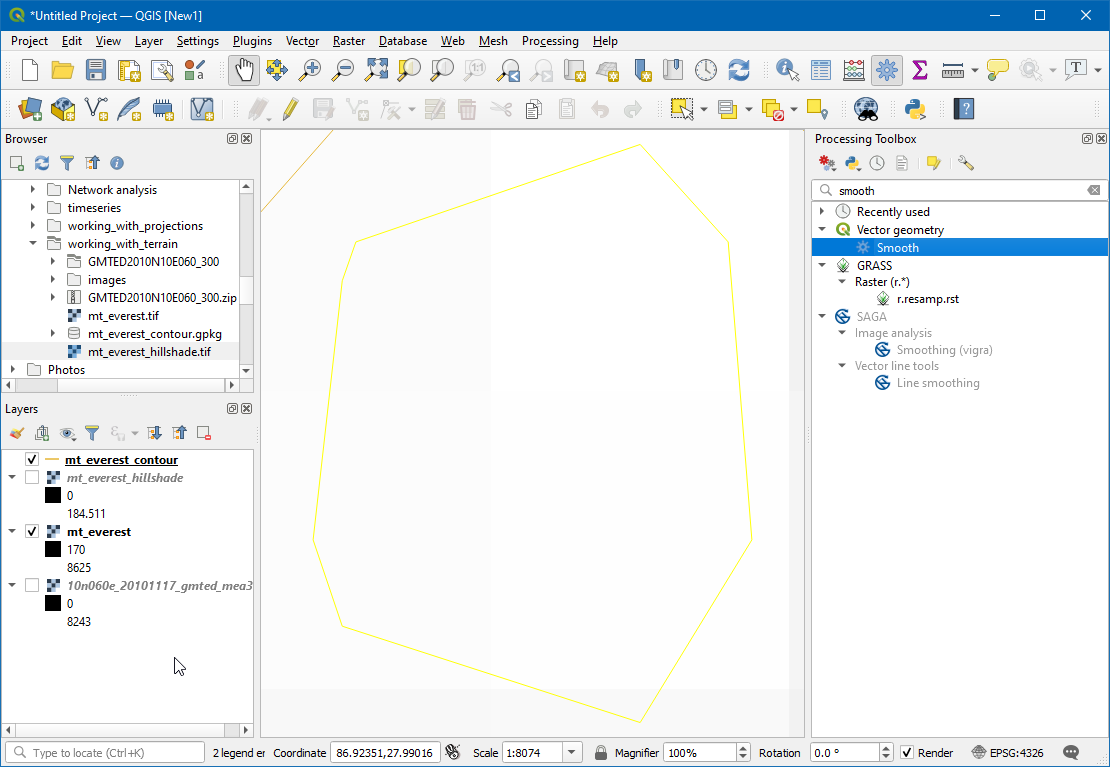
Select the top row, and click on the Zoom to selection button.
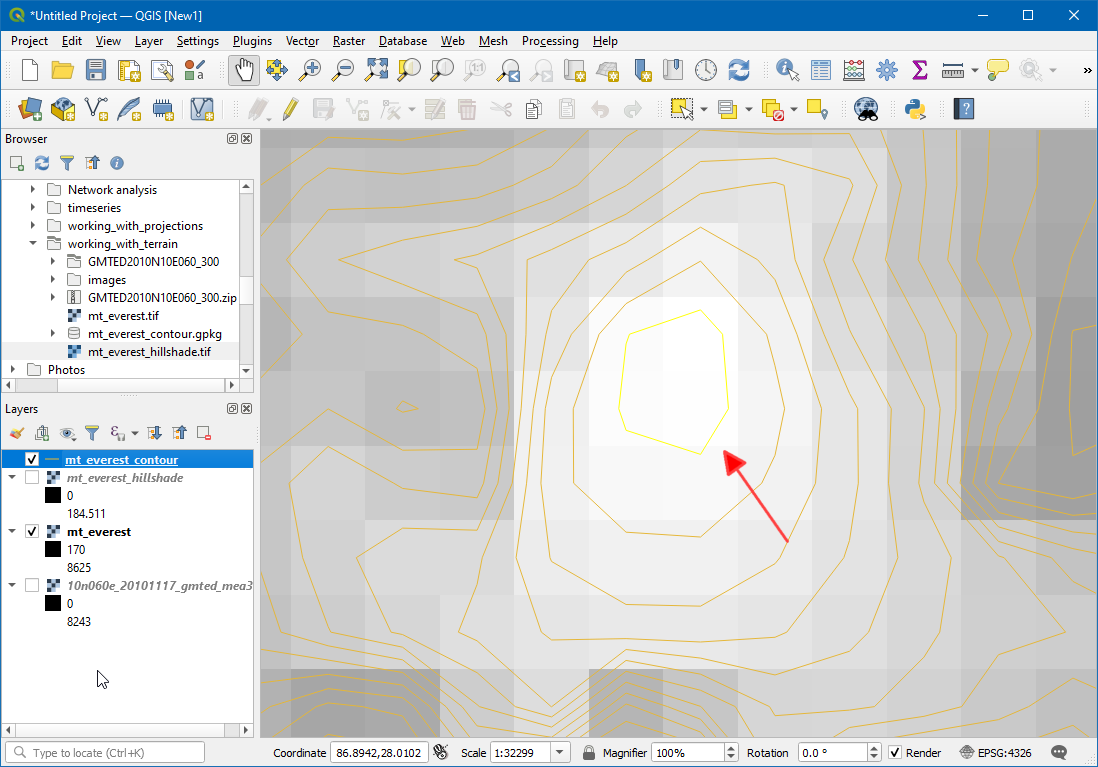
Switch to the main QGIS window. You will see the selected contour line highlighted in yellow. This is the area of the highest elevation in our dataset.
Search for Smooth in Processing Toolbox. Select the
Smoothunder Vector geometry.
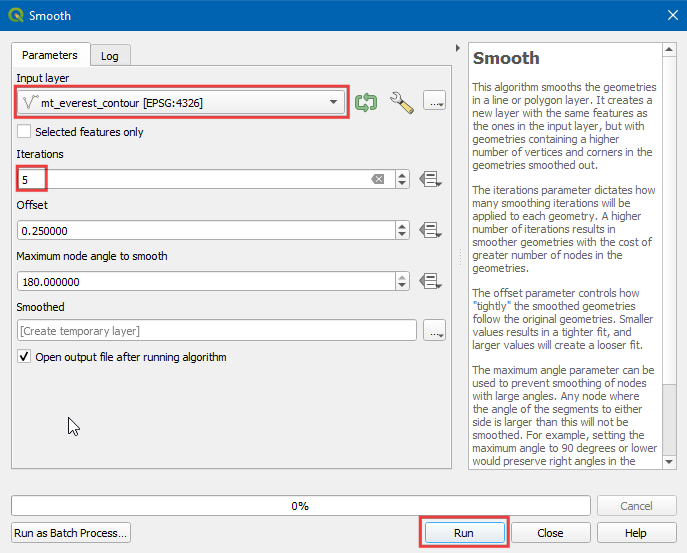
In the Smooth window, select
mt_everest_contouras Input Layer, enter5in Iterations. Click Run.
Warning
The smoothing algorithm works by adding extra vertices along the lines. As you increase the number of iterations, the number of vertices in the contour lines increase by a large amount. So be careful in using higher number of iterations. You can reduce the file size of the output by exporting it as a shapefile and simplifying the results using Mapshaper.
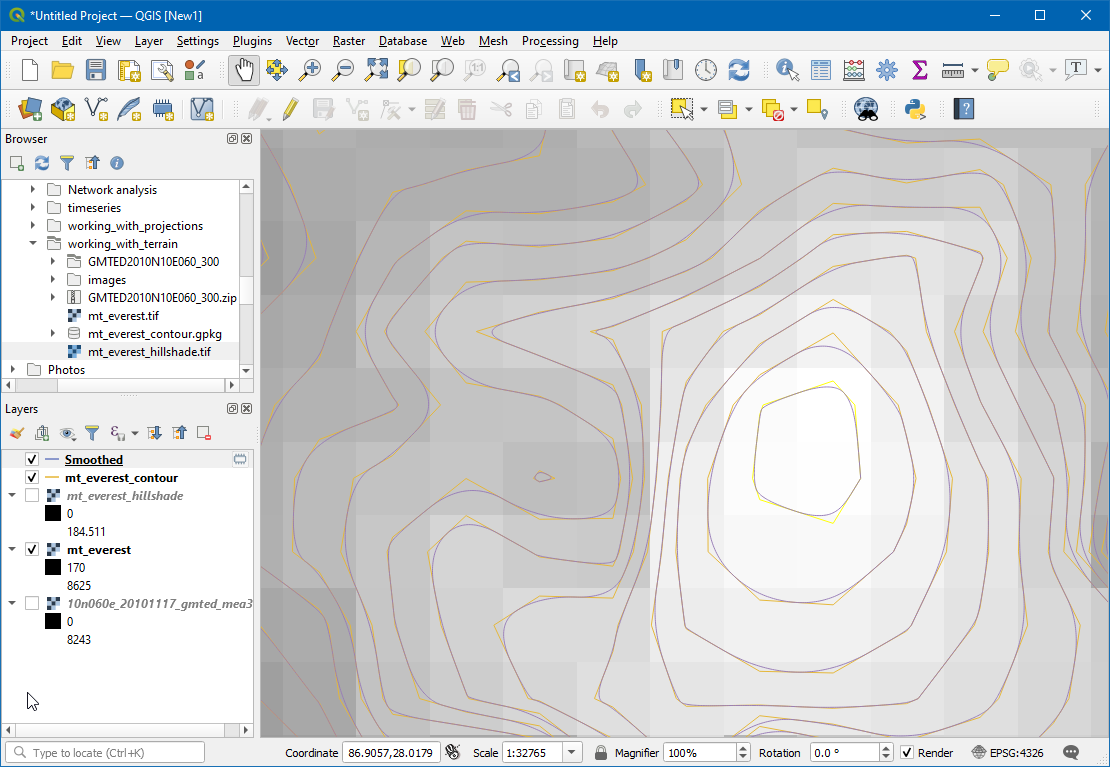
A new layer
Smoothedwill appear in the canvas. This layer will have more smooth edges compared to themt_everest_contourlayer.
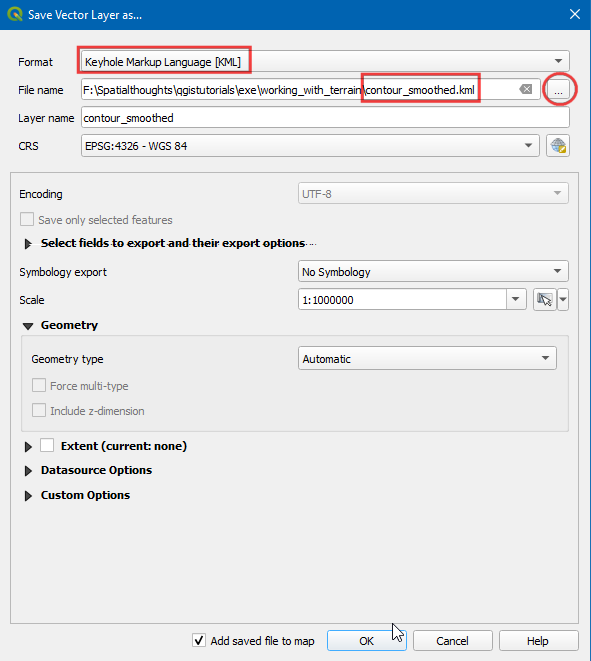
You can also visualize your contour layer and verify your analysis by exporting the contours layer as KML and viewing it in Google Earth. Right click on the smoothed layer, select .
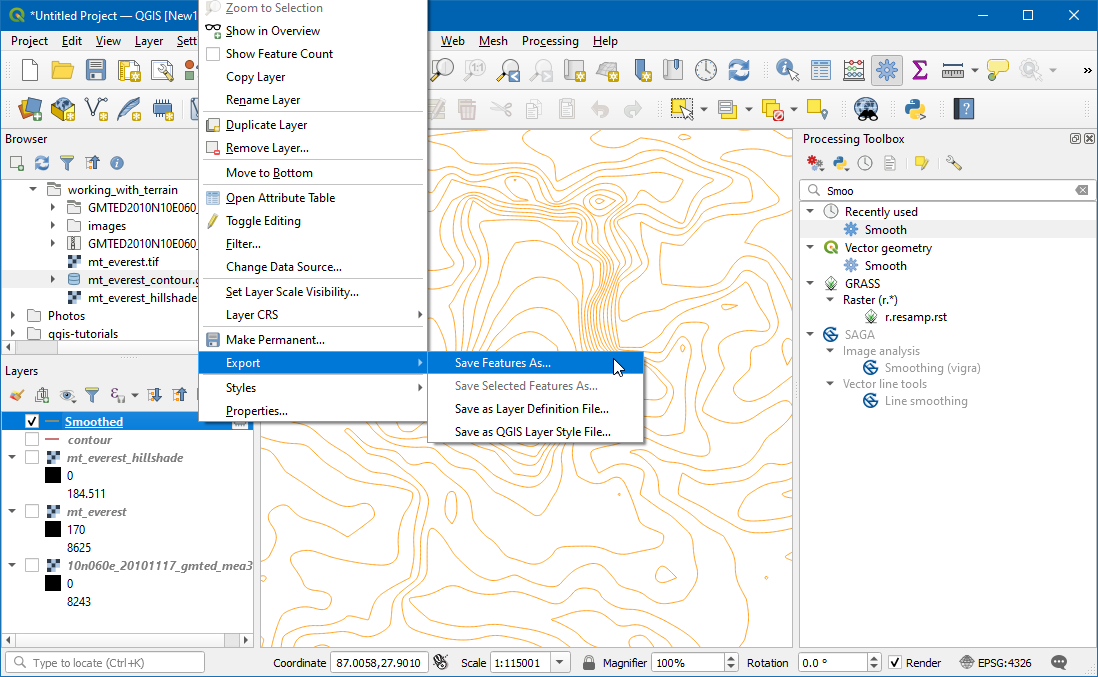
Select Keyhole Markup Language [KML] as the Format. Click
...in File name and enter the name ascontour_smoothed.kml. Click OK.
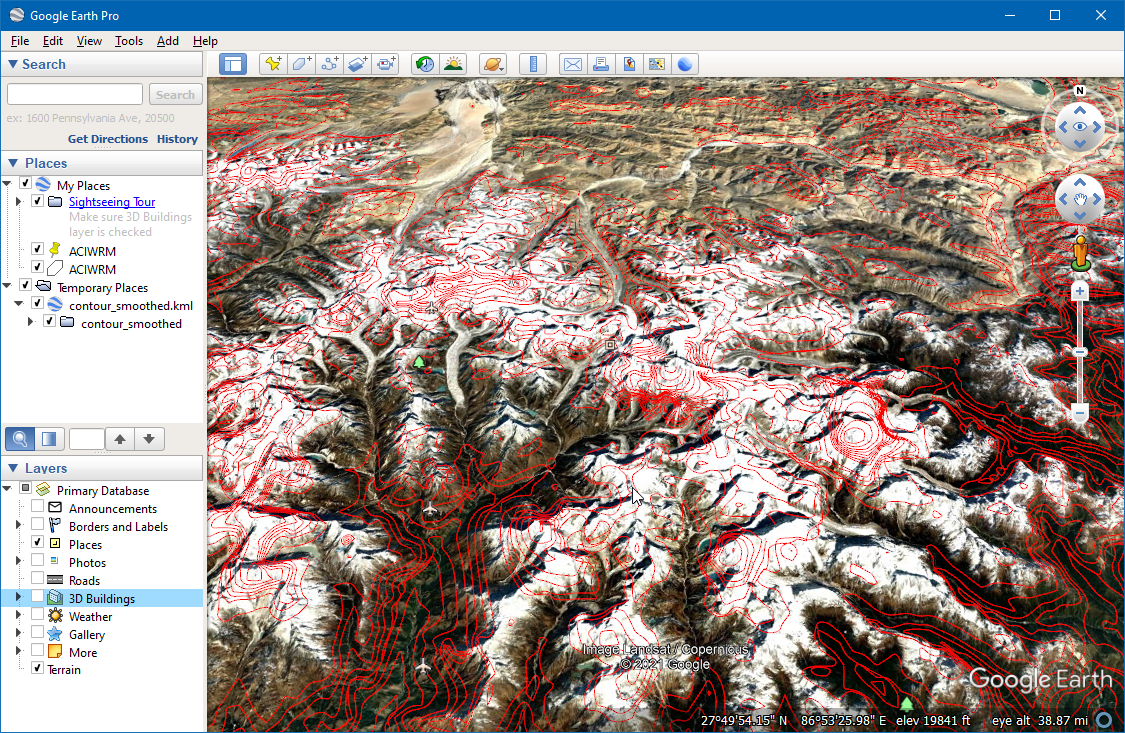
Browse to the output file on your disk and double-click on it to open Google Earth Pro.
If you want to give feedback or share your experience with this tutorial, please comment below. (requires GitHub account)