 Ujaval Gandhi
Automatizarea Creării Hărților cu ajutorul Atlasului (QGIS3)
Dacă organizația dvs. imprimă hărți sau le publică online, apare adesea nevoia de a crea unele hărți pe baza aceluiași șablon - de obicei câte unul pentru fiecare unitate administrativă sau regiune de interes. Crearea manuală a acestor hărți poate fi consumatoare de timp, iar dacă acestea necesită actualizare periodică, atunci totul se poate transforma într-o adevărată corvoadă. QGIS dispune de un instrument numit Atlas care vă poate ajuta să creați un șablon, pe baza căruia să publicați cu ușurință un număr mare de hărți, pentru diferite regiuni geografice. Dacă nu sunteți familiarizați cu elementele de bază privind Paginarea Compozițiilor, puteți parcurge tutorialul Crearea unei Hărți.
Privire de ansamblu asupra activității
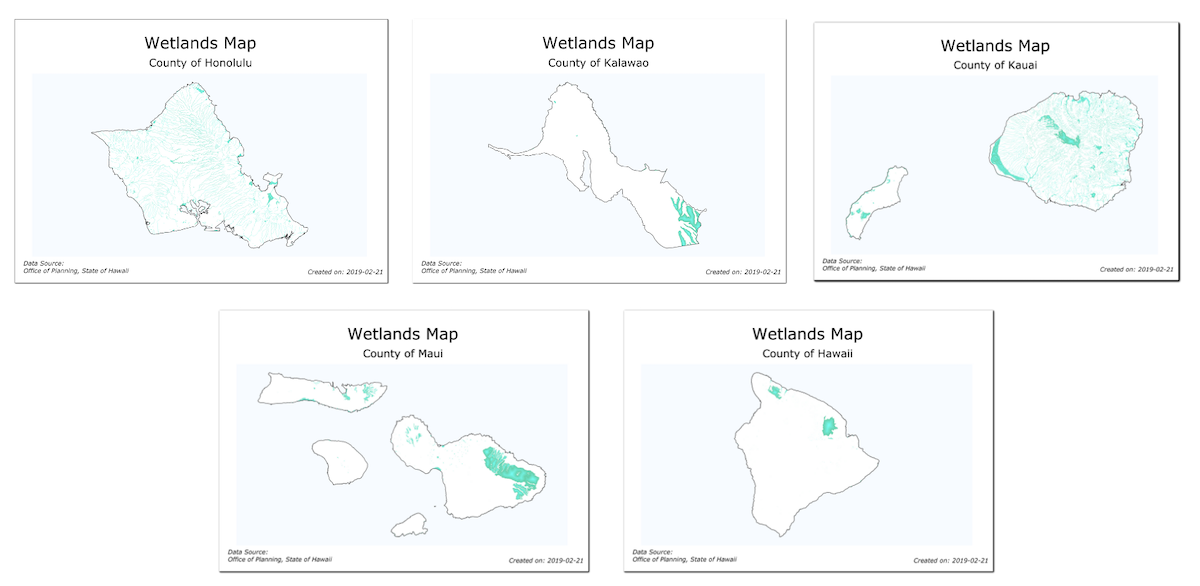
Acest tutorial vă arată cum să creați harta zonelor mlăștinoase pentru fiecare regiune din statul Hawaii.
Alte competențe pe care le veți dobândi
Utilizarea stilului de randare
Poligoane Inversatepentru umplerea zonelor din afara poligoanelor.Scrierea unei expresii folosind stilul de randare
Bazat pe Reguli, în scopul afișării doar a entității curente din Atlas.Scrierea unei expresii dedicată creării de etichete dinamice în modulul de Paginare a Compoziților.
Utilizarea stilului de umplere
Shapeburstla umplerea bitonală a poligoanelor.
Obținerea datelor
Vom folosi Straturile de Date GIS din Statul Hawaii - Biroul de Planificare
Descărcați stratul de `Zone umede http://files.hawaii.gov/dbedt/op/gis/data/HI_Wetlands.shp.zip>`_ din categoriile Biologică și Ecologică.
Descărcați stratul Limitelor recensământului regional 2010 din categoria Cultură și Demografie.
Pentru comoditate, puteți descărca direct o copie a ambelor seturi de date, accesând linkurile de mai jos:
Sursa de date: [HAWAII]
Procedura
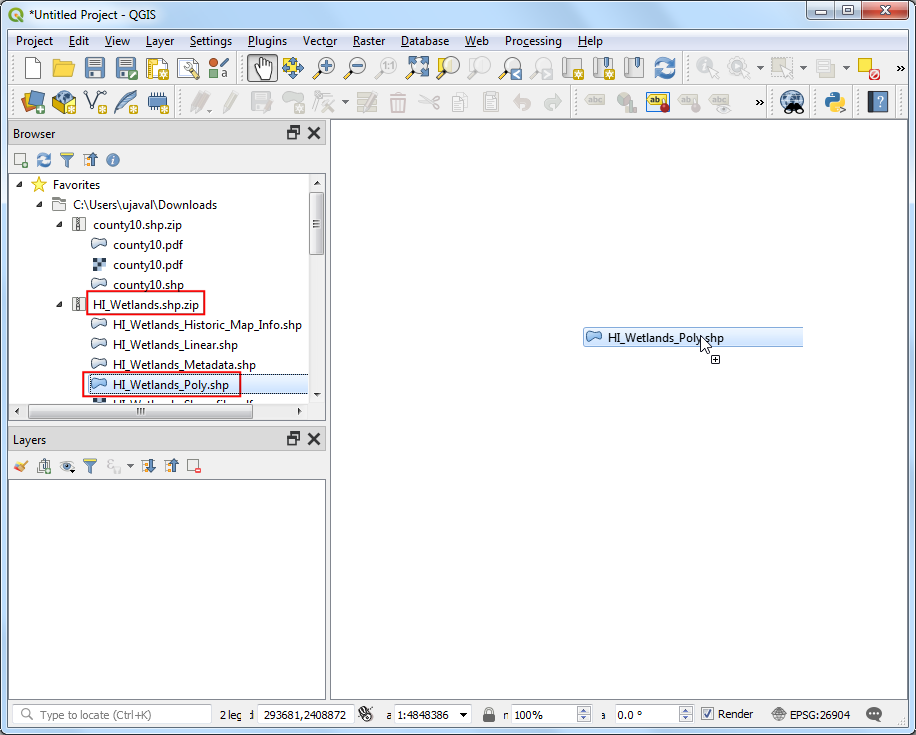
Locate the
HI_Wetlands.shp.zipfile in the QGIS Browser and expand it. Select theHI_Wetlands_Poly.shpfile and drag it to the canvas. This layer contains polygons representing wetlands in the entire state of Hawaii.
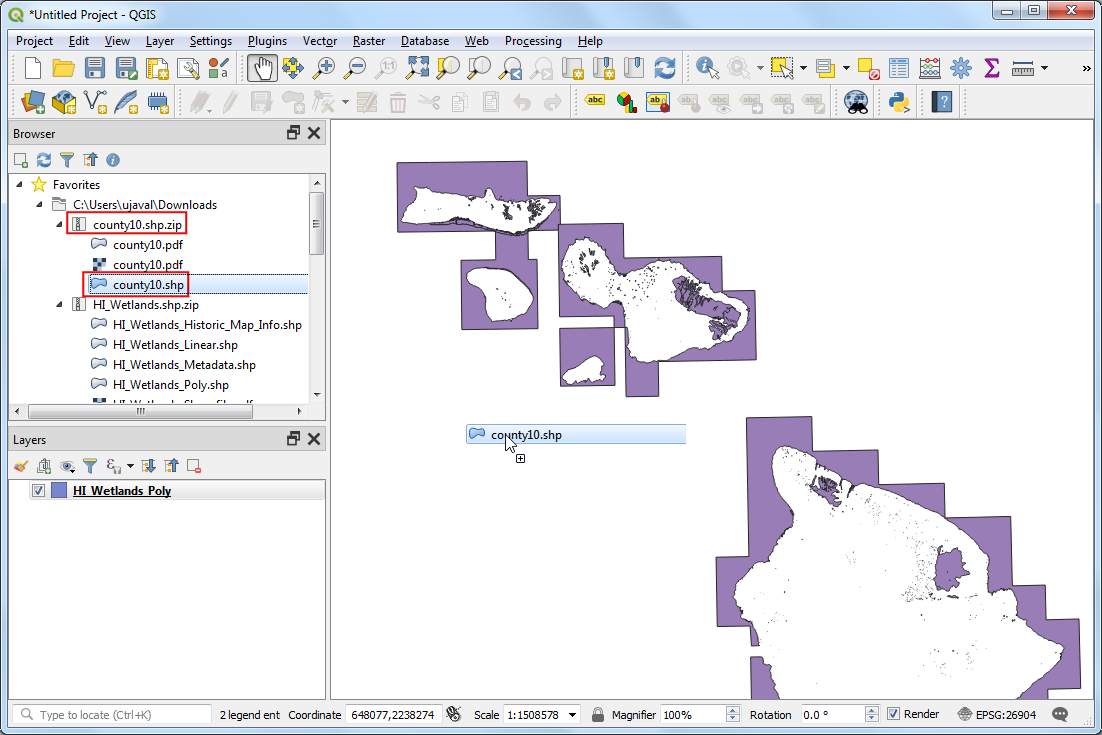
Since we want to make separate wetlands map for each county in the state, we will need the county boundaries layer. Browse to the
county10.shp.zipfile and expand it. Select thecounty10.shpfile and drag it to the canvas.
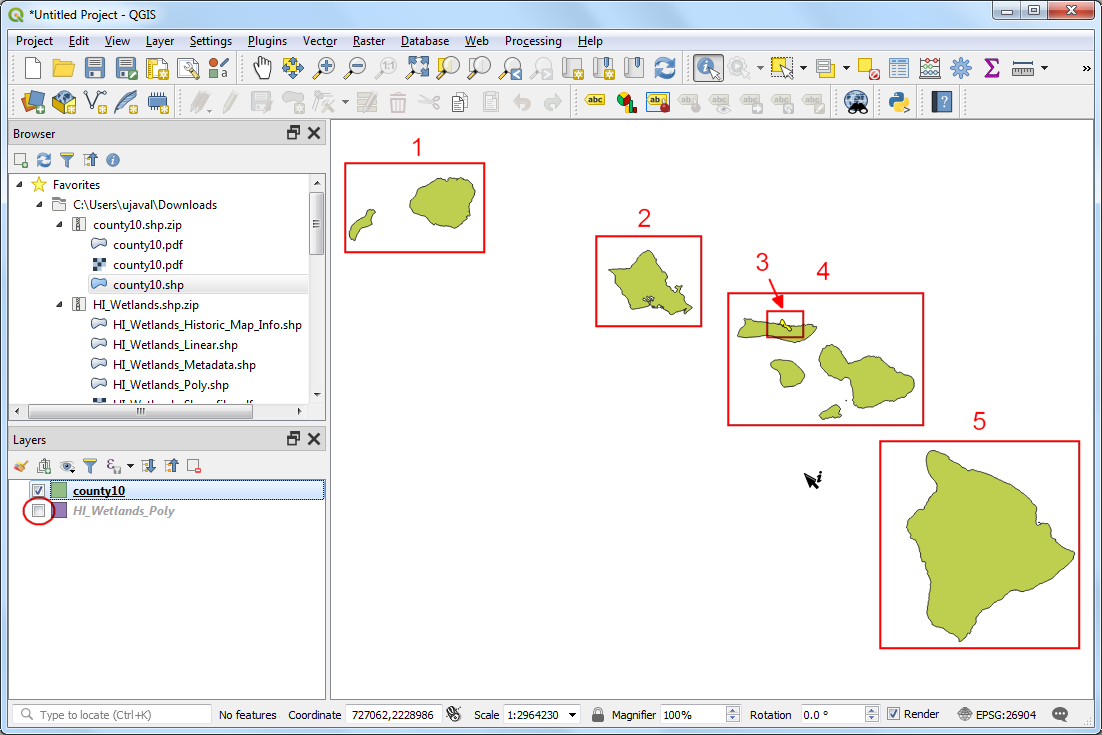
Turn off the visibility of the
HI_Wetlands_Polylayer temporarily. You will see the polygons from thecounty10layer clearly now. There are 5 features contained in this layer, with each feature having 1 or more polygons associated with it. The features represent 5 counties. We will use this layer as the coverage layer and configure QGIS to create 5 separate maps - one for each feature - automatically.
Turn on the visibility of the
HI_Wetlands_Polylayer. Go to .
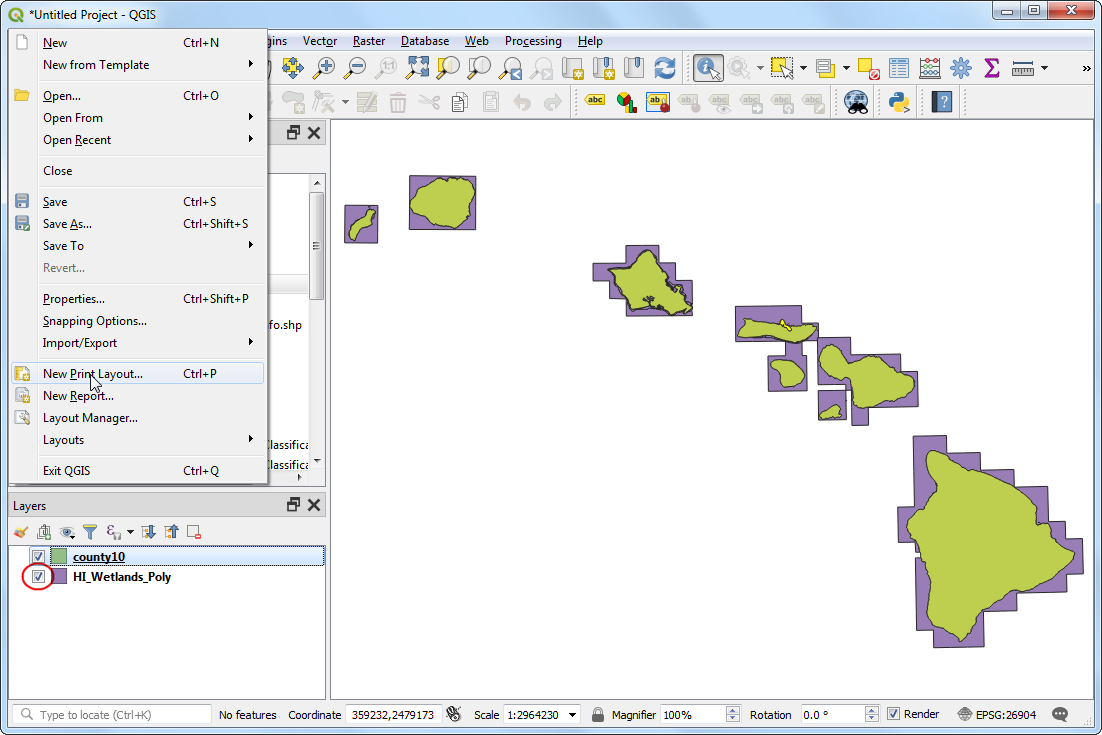
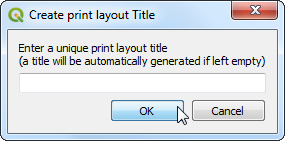
Lăsați necompletat titlul compoziției, apoi faceți clic pe OK.
In the Print Layout window, go to .
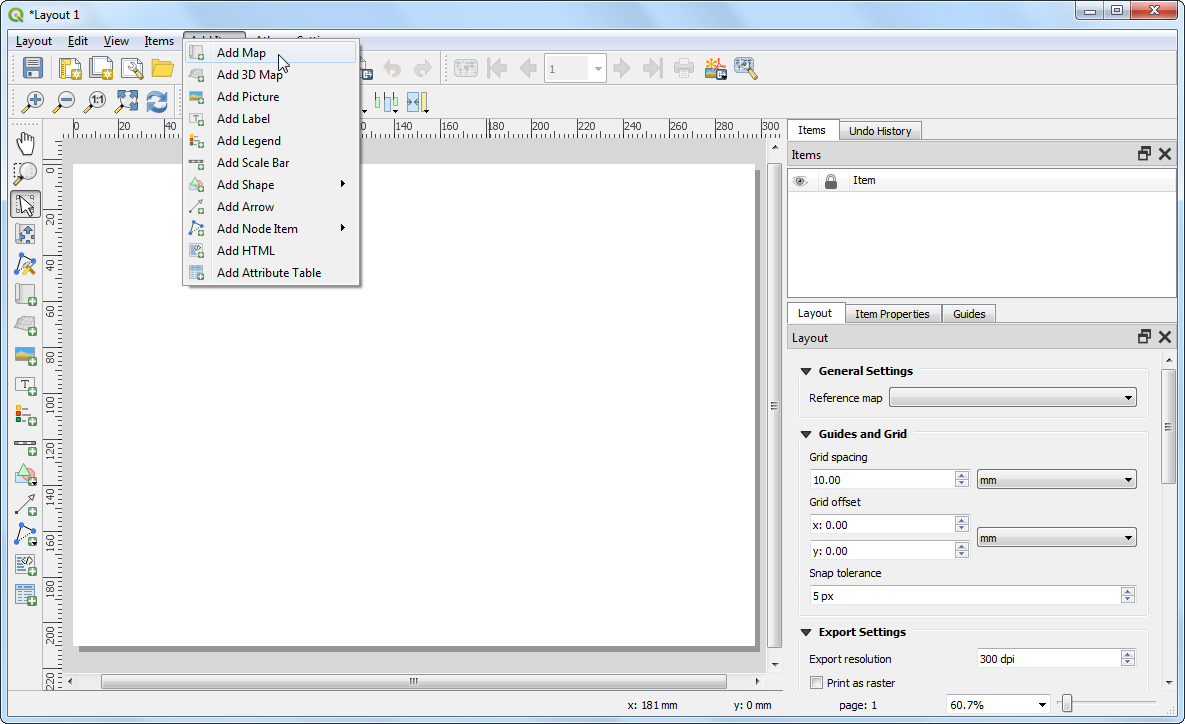
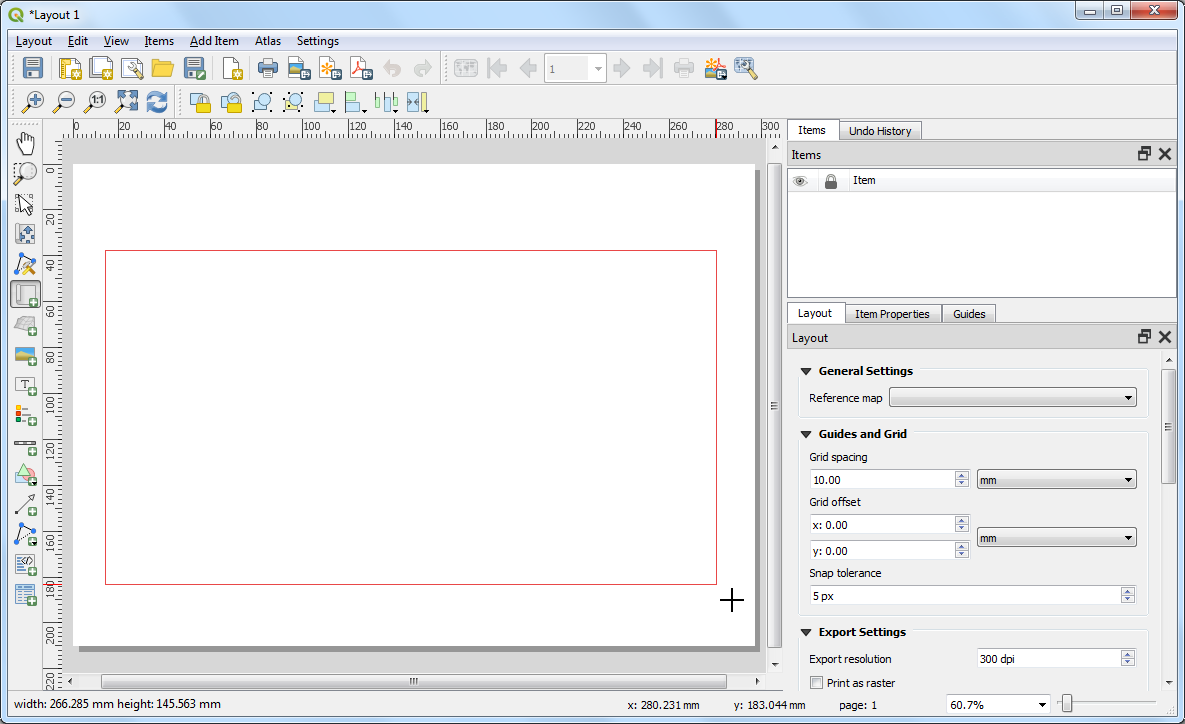
Drag a rectangle while holding the left mouse button where you would like to insert the map.
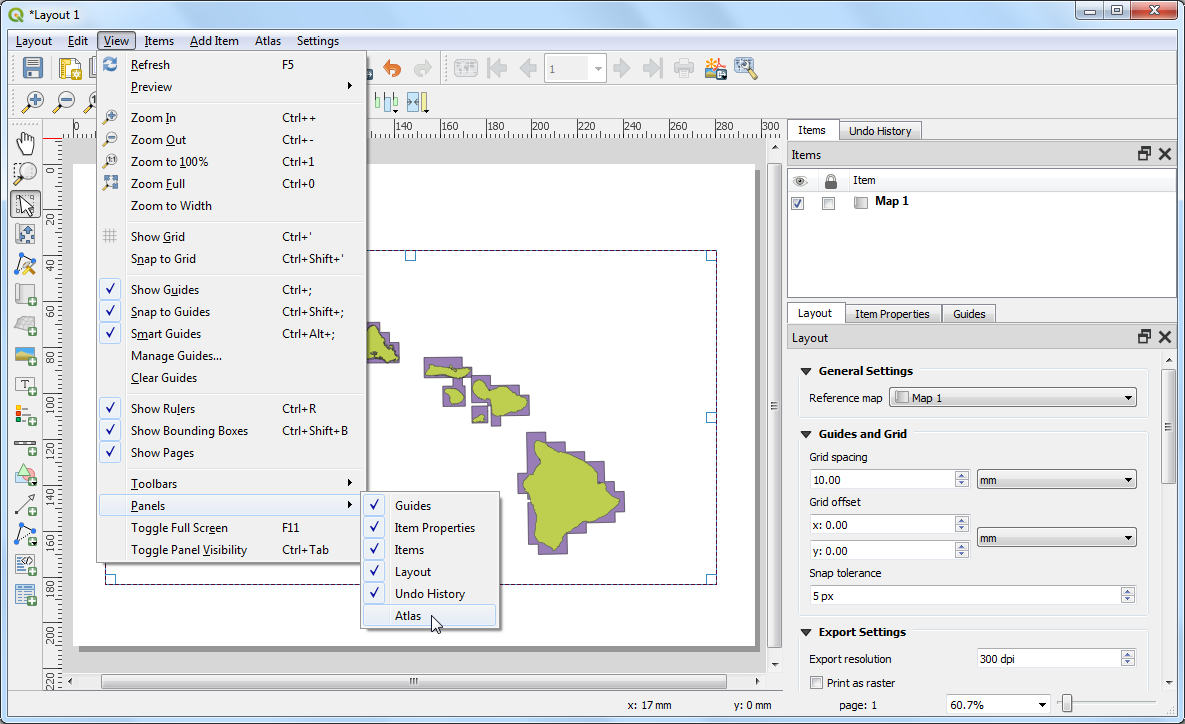
In QGIS3, the Atlas tab is not visible by default. Select .
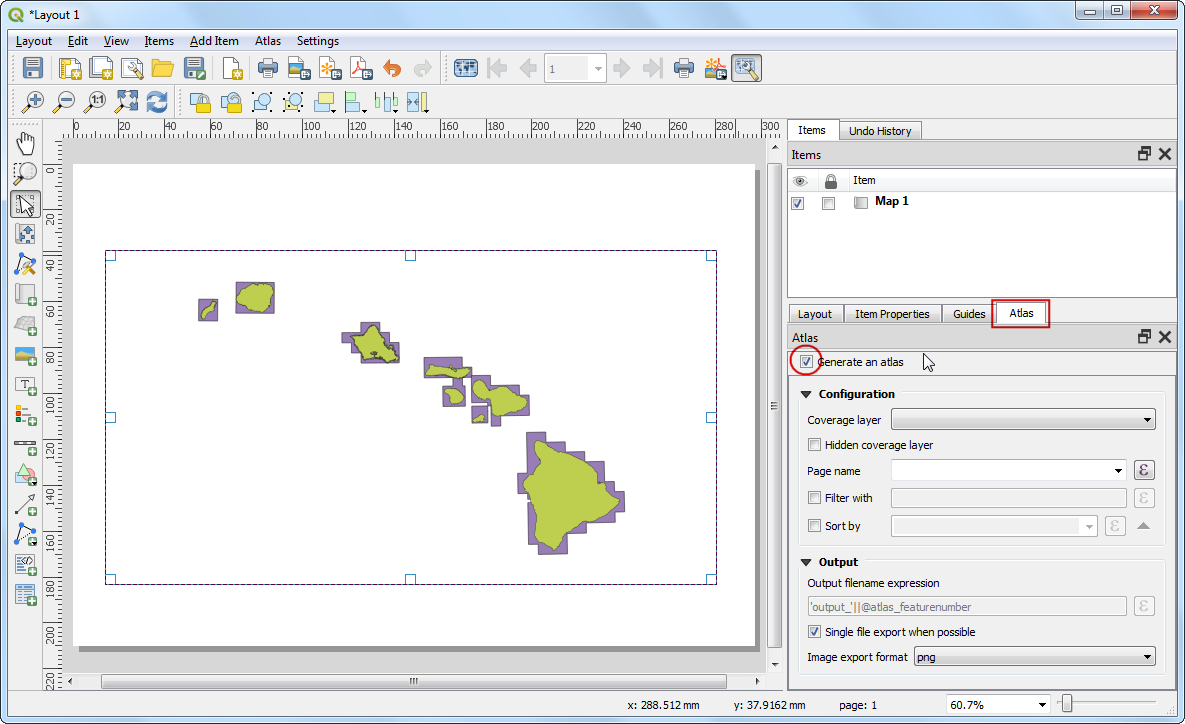
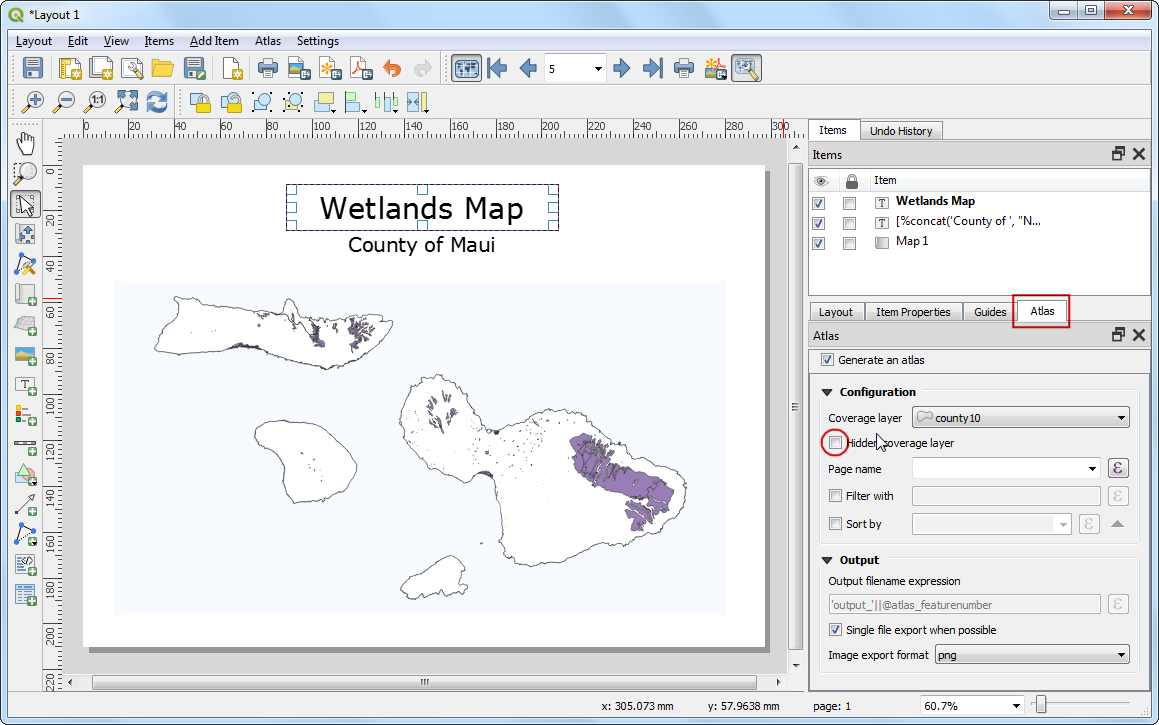
Switch to the Atlas tab. Check the Generate an atlas box.
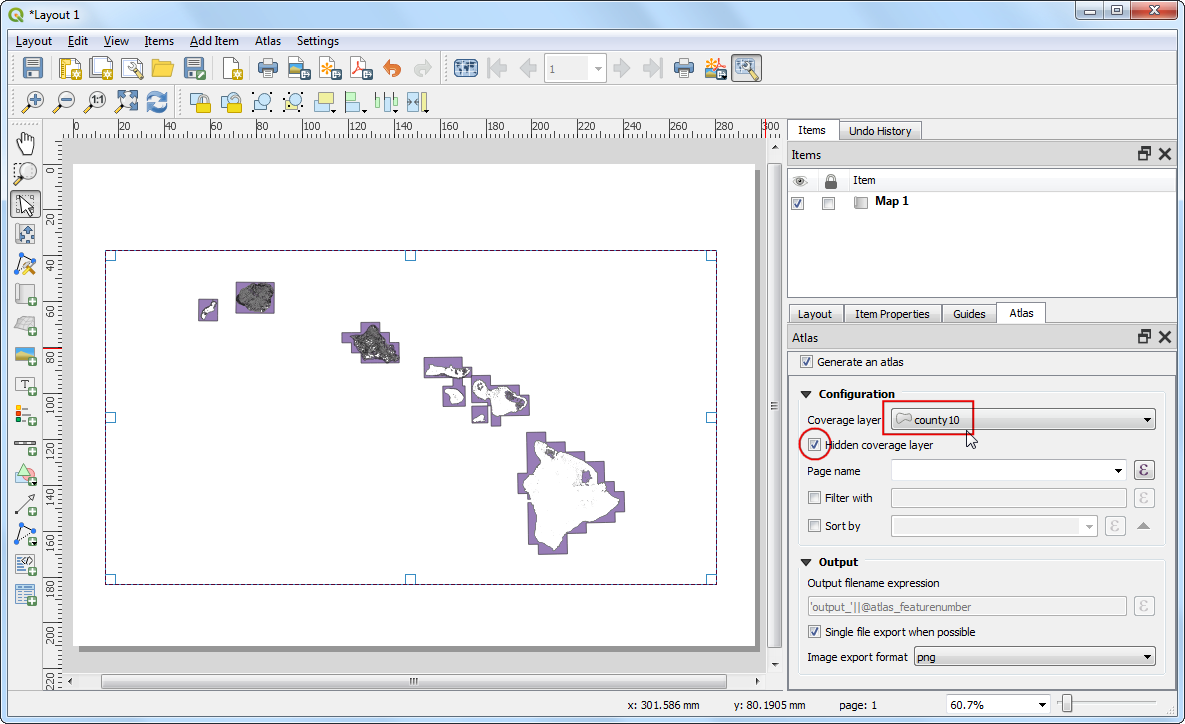
Select the
county10as the Coverage layer. This will indicate that we want to create 1 map each for every polygon feature in thecounty10layer. You can also check the Hidden coverage layer so that the features themselves will not appear on the map.
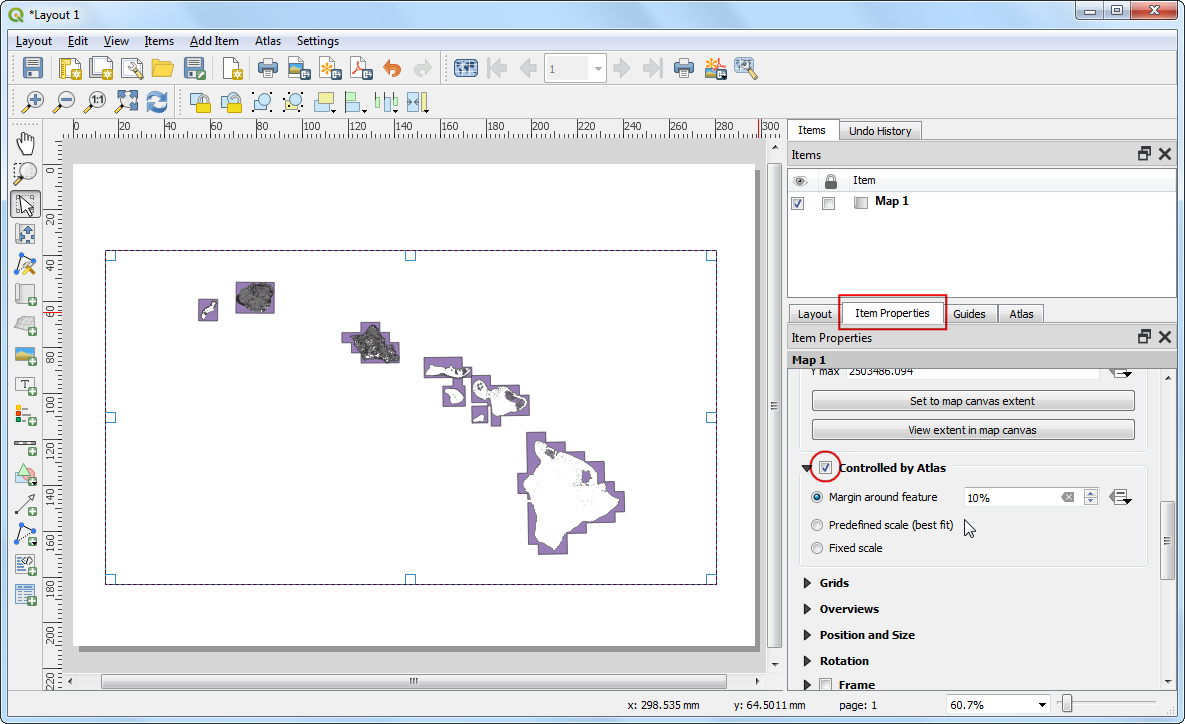
Switch to the Item Properties tab. Scroll down and check the Controlled by atlas box. This will indicate the layout that the content of the map displayed in this item will be determined by the
Atlastool.
Notă
You must enable the Generare an atlas box in the Atlas tab, otherwise the Controlled by atlas checkbox will be diasbled.
Now that you have configuring the Atlas settings, go to .
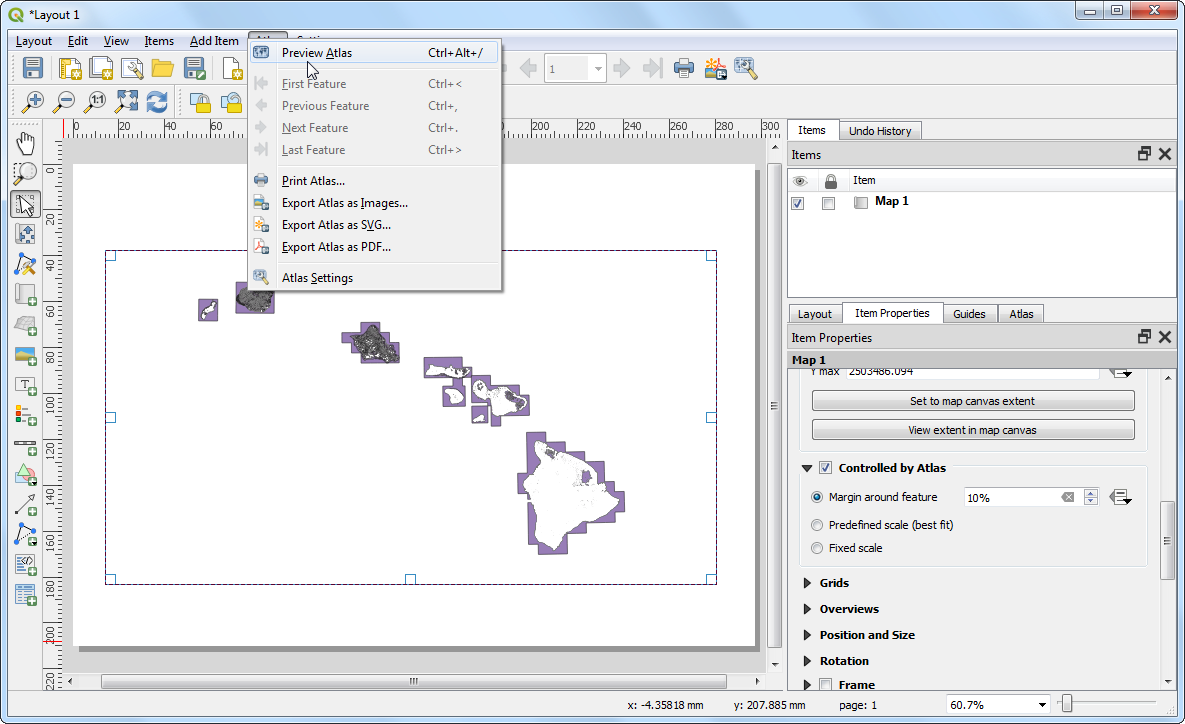
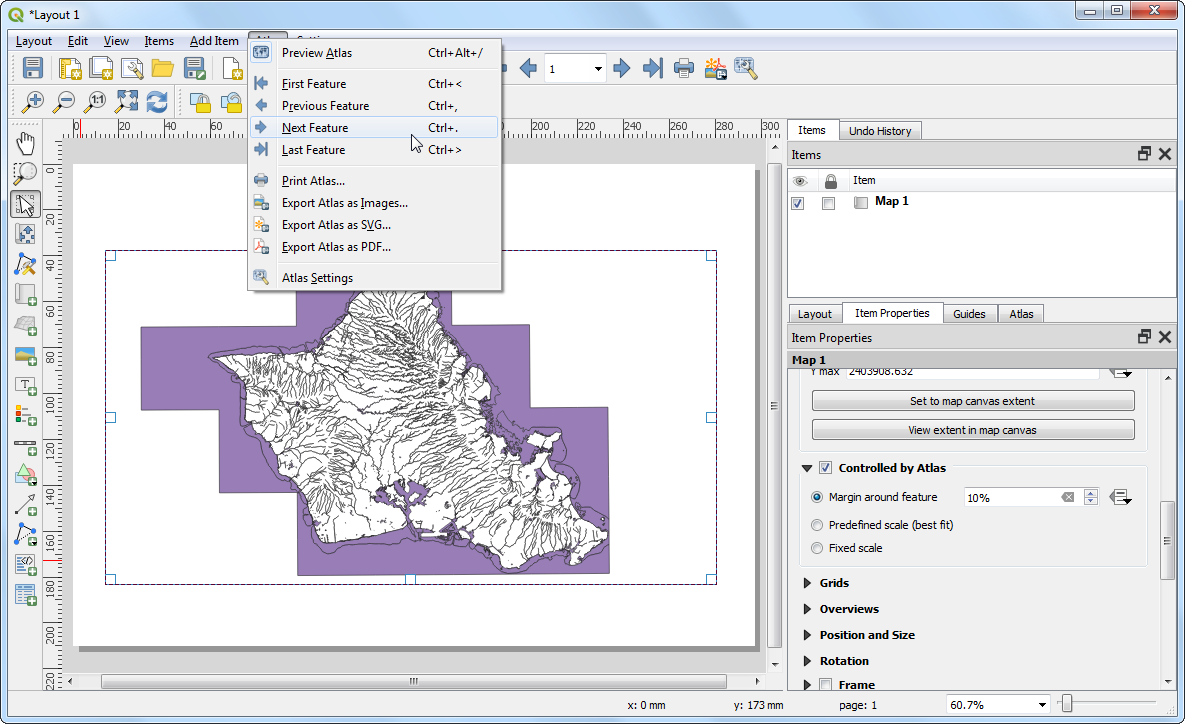
You will see the map refresh and show how individual map will look like. You can preview how the map will look for each of the county polygons. Go to . Atlas will render the map to the extent of the next feature in the coverage layer.
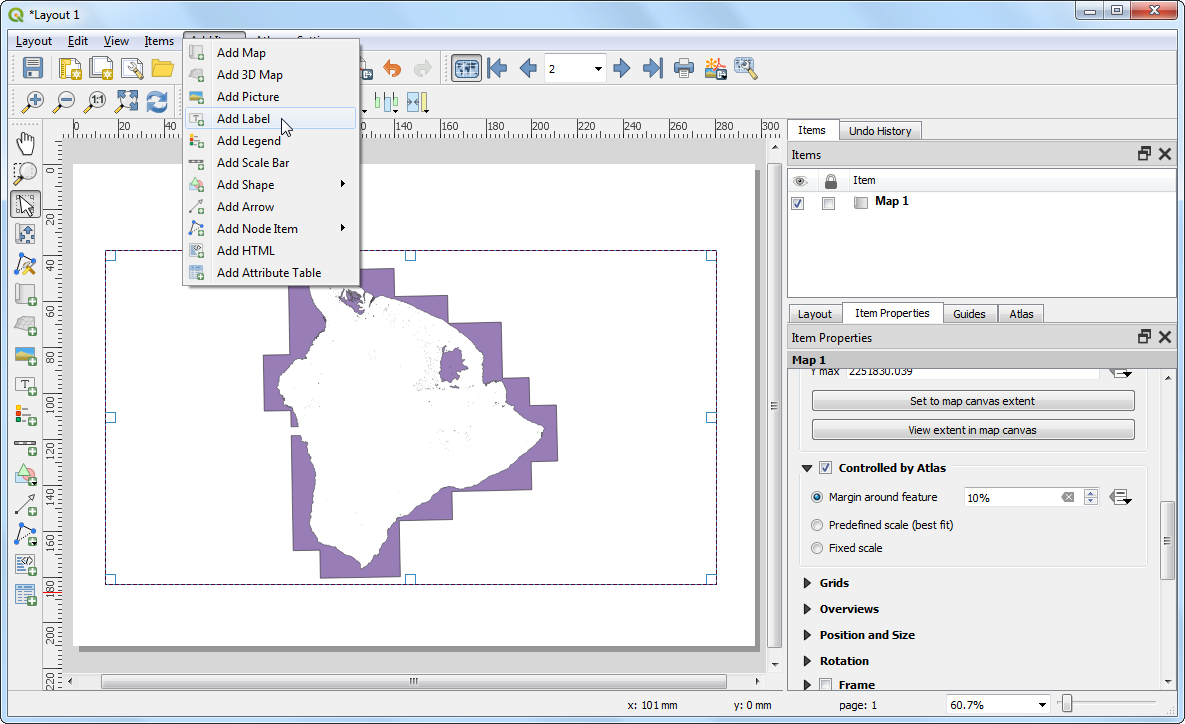
Let’s add a label to the map. Go to .
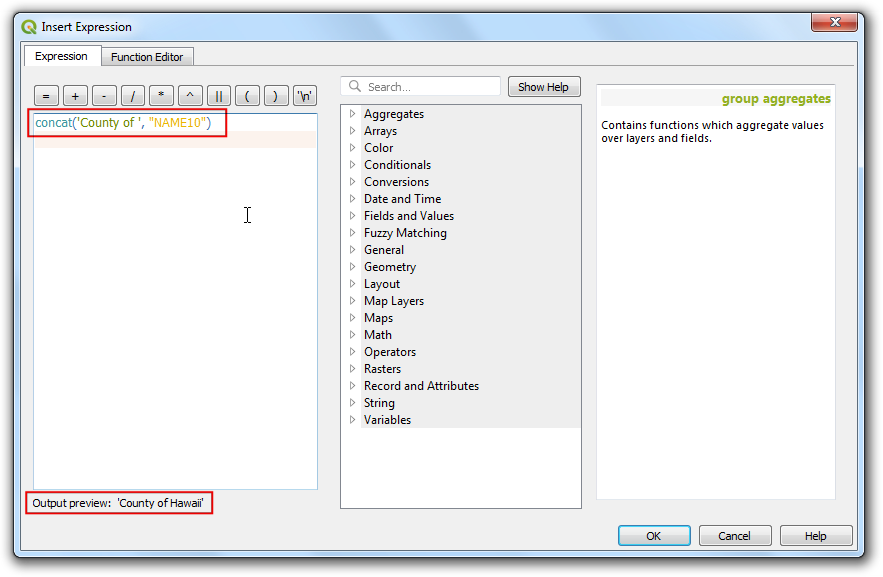
Under the Item properties tab, locate the Main properties section and click Insert an Expression… button.
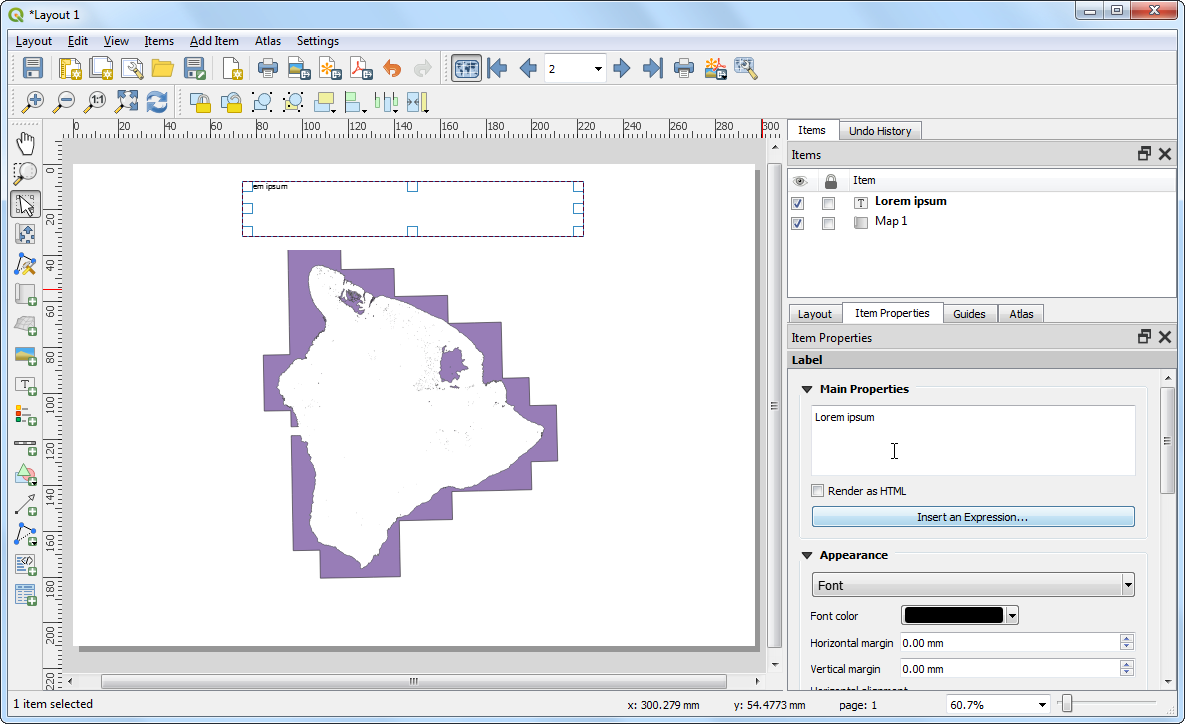
The label of the map can use the attributes from the coverage layer. The
concatfunction is used to join multiple text items into a single text item. In this case we will join the value of theNAME10attribute of thecounty10layer with the textCounty of. Add an expression like below and click OK.
concat('County of ', "NAME10")
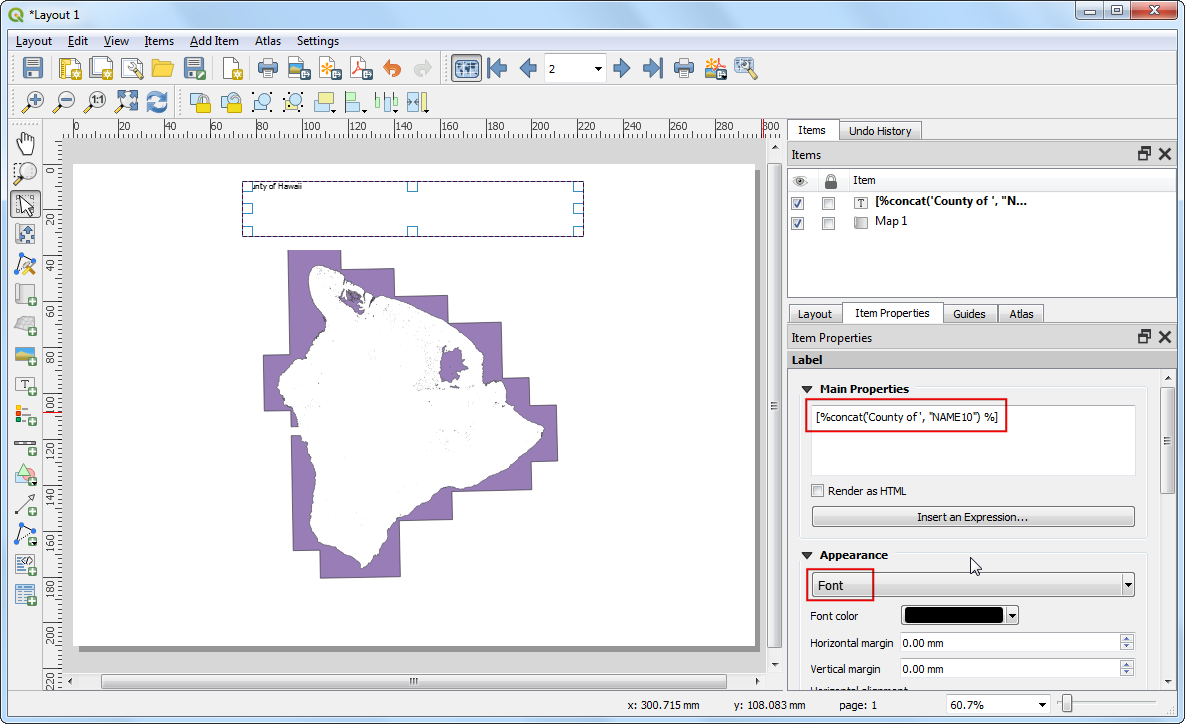
Delete the leading Lorem ipsum placeholder text so that the textbox contains only the expression. Scroll down to the Appearance section and click on the Font dropdown. Choose the font and adjust the size to your liking.
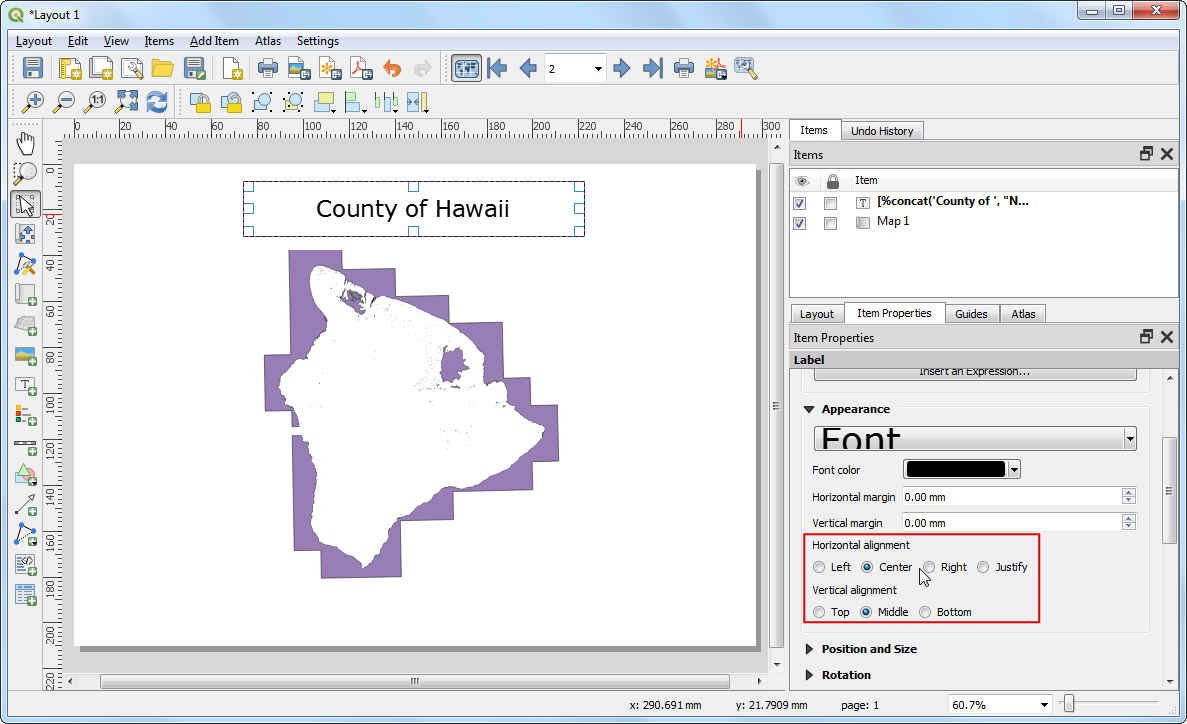
Choose
Centeras the Horizontal alignment andMiddleas the Vertical alignment option.
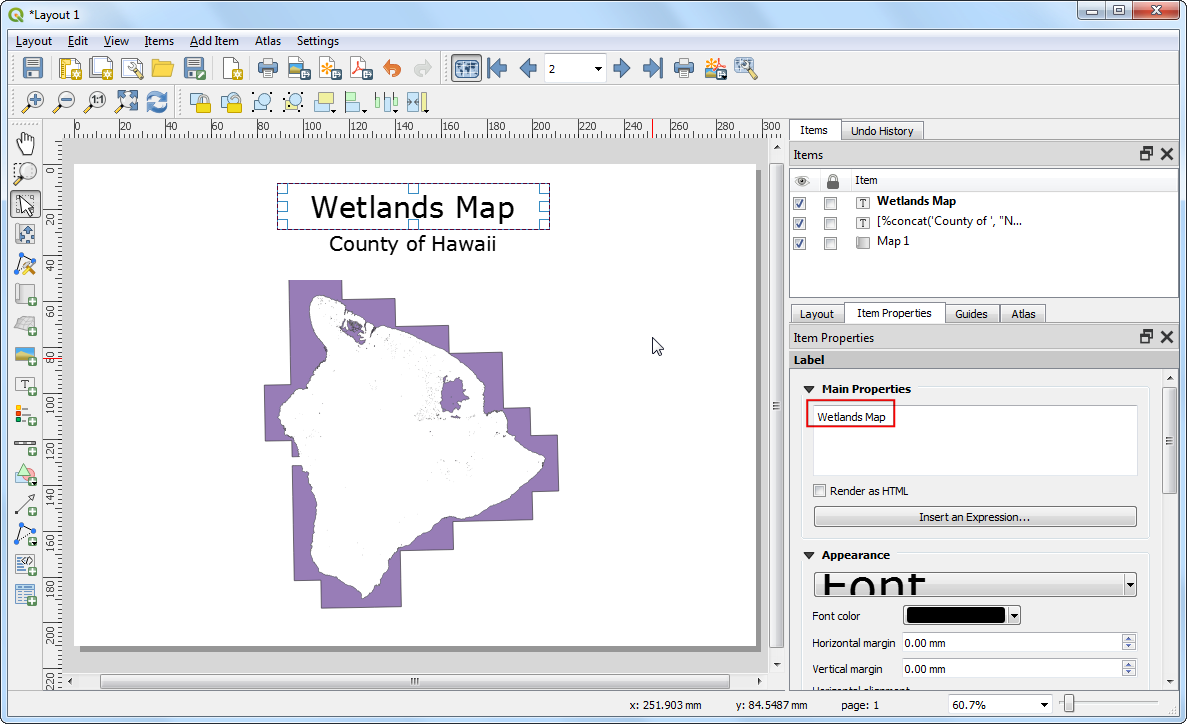
Add another label and enter
Wetlands Mapunder the Main properties. Since there is no expression here, this text will remain the same on all maps.
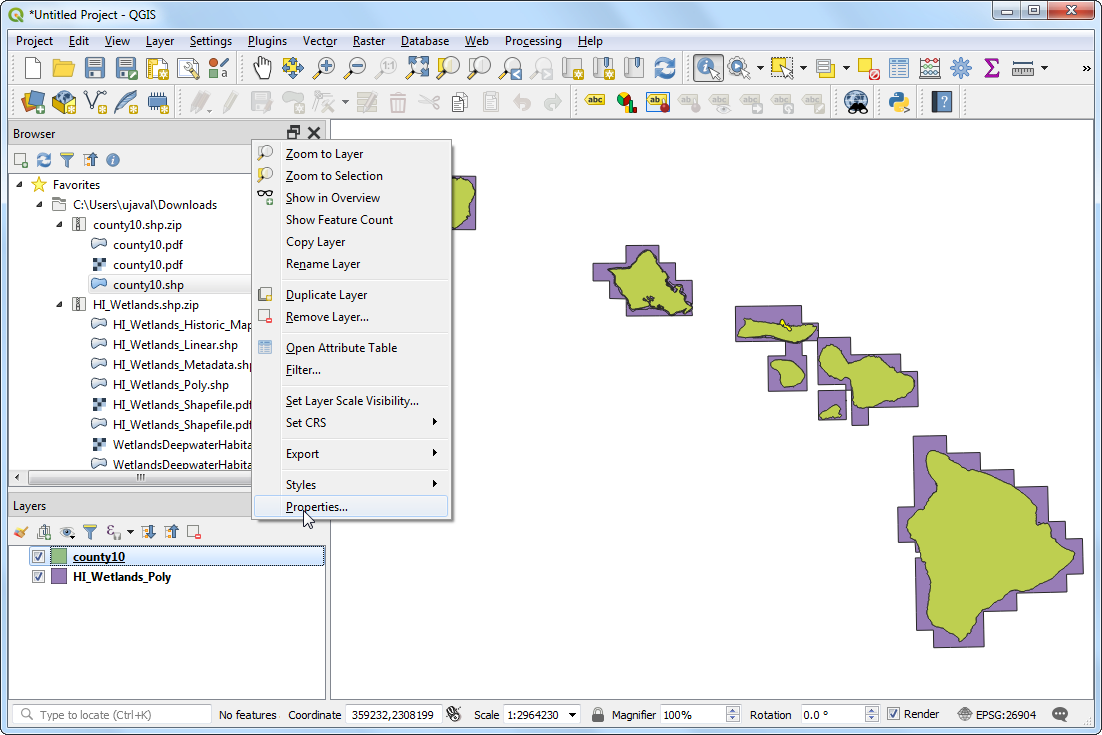
Go to and verify that the map labels do work as intended. You will notice that the wetland map has polygons extending out in the ocean that looks ugly. We can change the style to that areas outside the county boundaries are hidden.
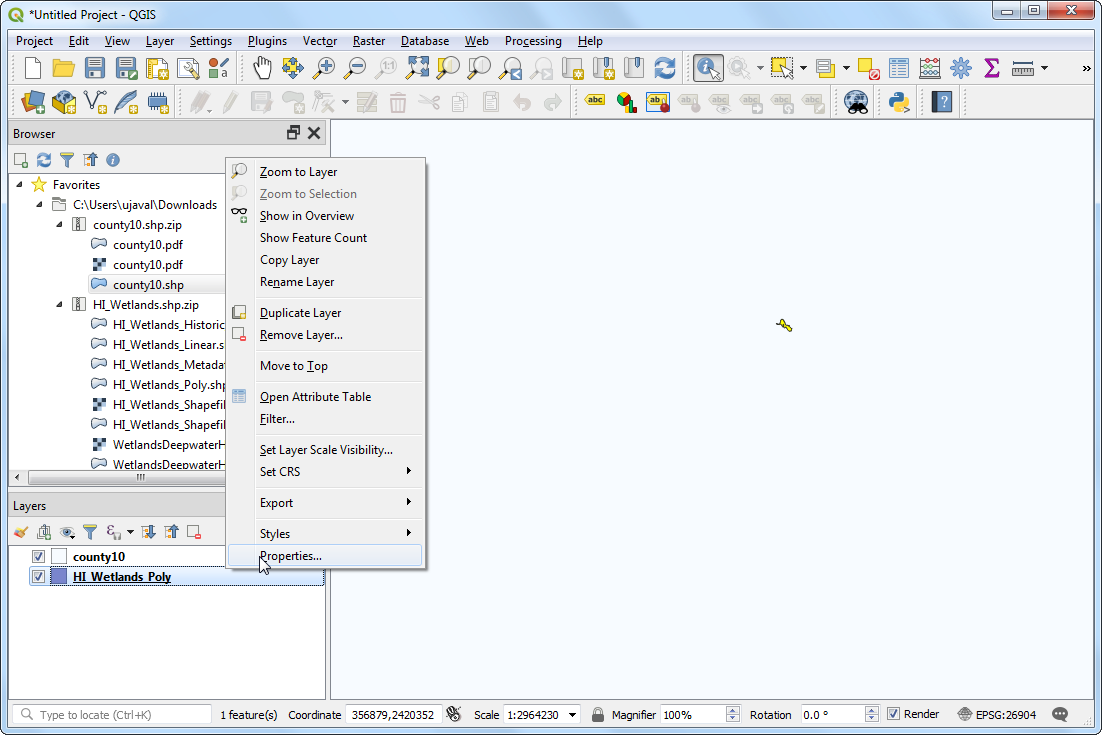
Switch to the main QGIS window. Right-click the
county10layer and select Properties.
In the Symbology tab, select the Inverted polygons renderer. This renderer styles the outside of the polygon - not inside. Select white as the fill color and click OK.
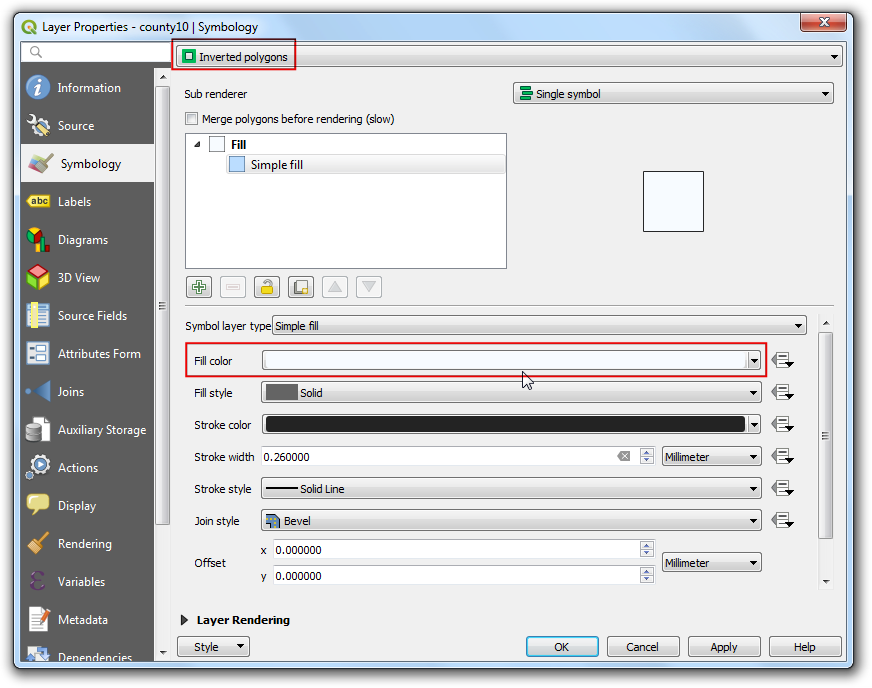
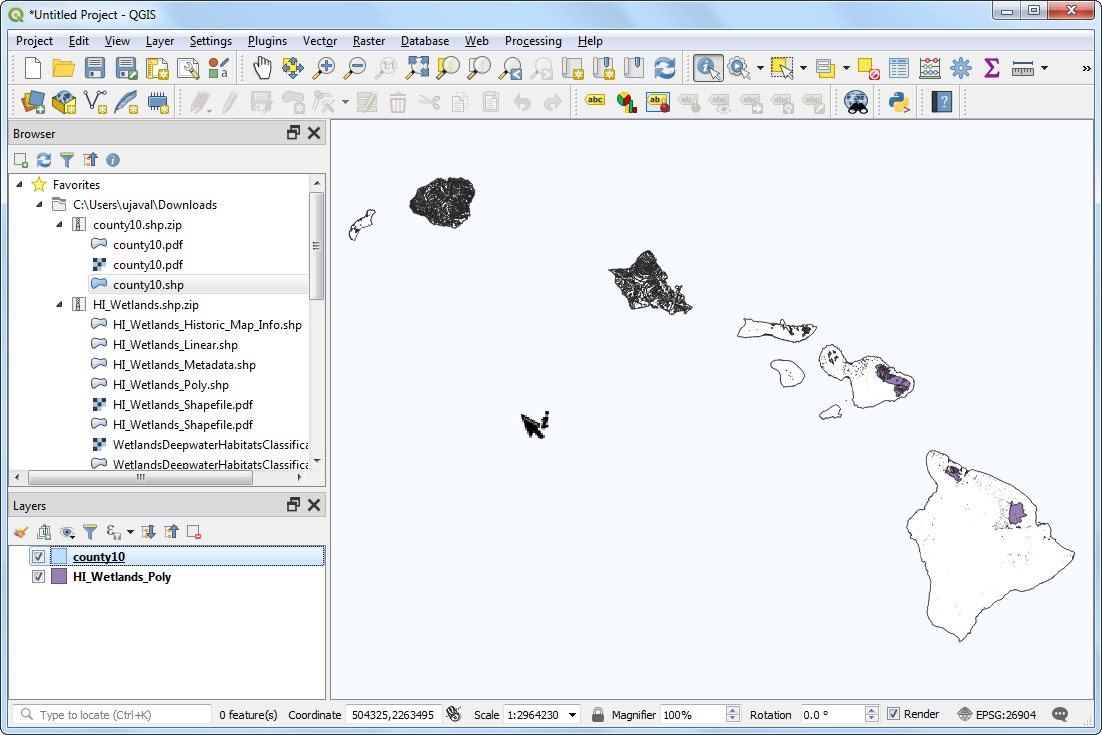
You will notice that the polygons extending outside of the county boundaries are now disappeared. In reality, they are hidden by the white color fill extending out from the county polygons because of the Inverted polygons style.
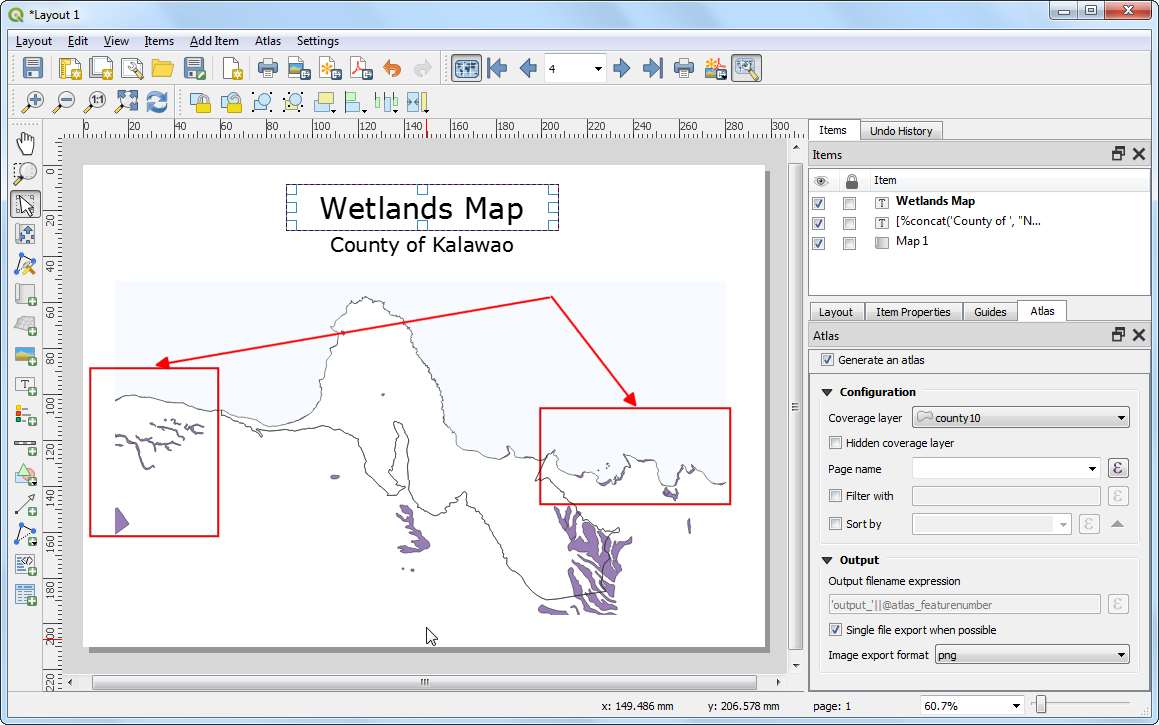
Switch to the Layout window. If we want the effect of the inverted polygons to show, we need to uncheck the Hidden coverage layer box under Atlas tab. Once unchecked, the rendered image will appear clean and areas outside the coverage polygon is not visible.
There is one more problem though. You will notice that in some cases, parts of the map that are outside the coverage layer boundary are still visible. This is because Atlas doesn’t automatically hide other features. This can be useful in some cases, but for our purpose, we only want to show wetlands of the county whose map is being generated. To fix this, switch back to the main QGIS window and right-click the
county10layer and select Properties.
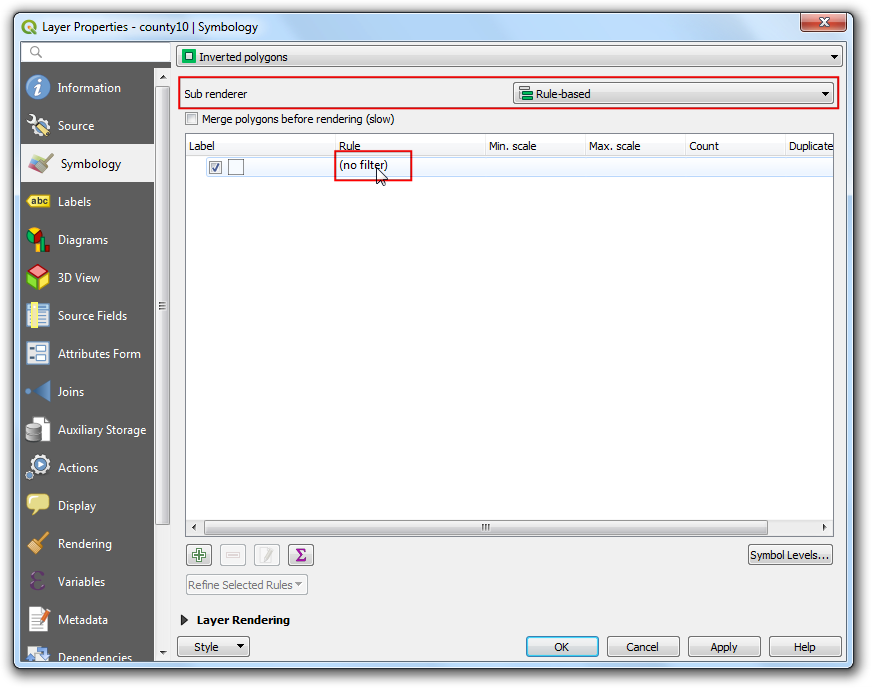
In the Symbology tab, select
Rule-basedas the Sub renderer. Double-click the area under Rule.
In the Edit rule dialog, click the Expression button next to Filter.
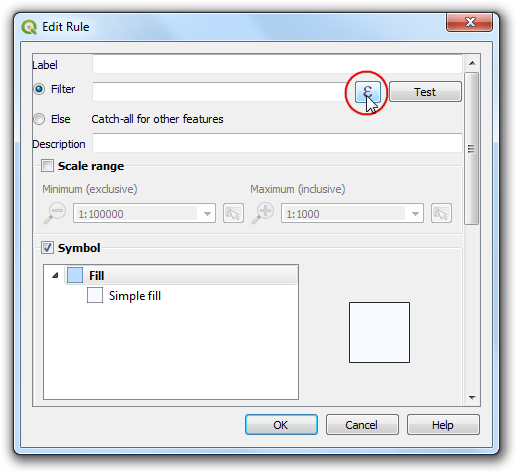
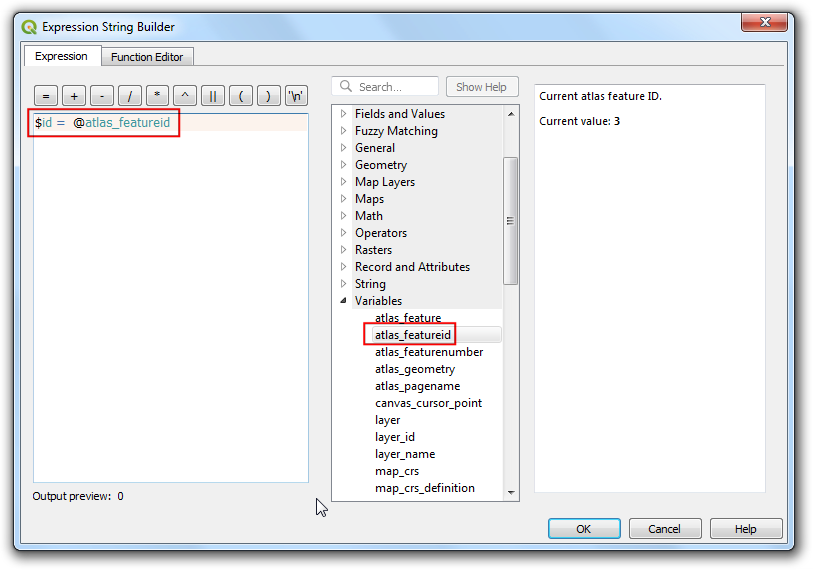
In the Expression string builder, expand the Variables group of functions. The
@atlas_featureidvariable stores the id of the the currently selected feature. We will construct an expression that will select only the currently selected Atlas feature. Enter the expression as below and click OK.
$id = @atlas_featureid
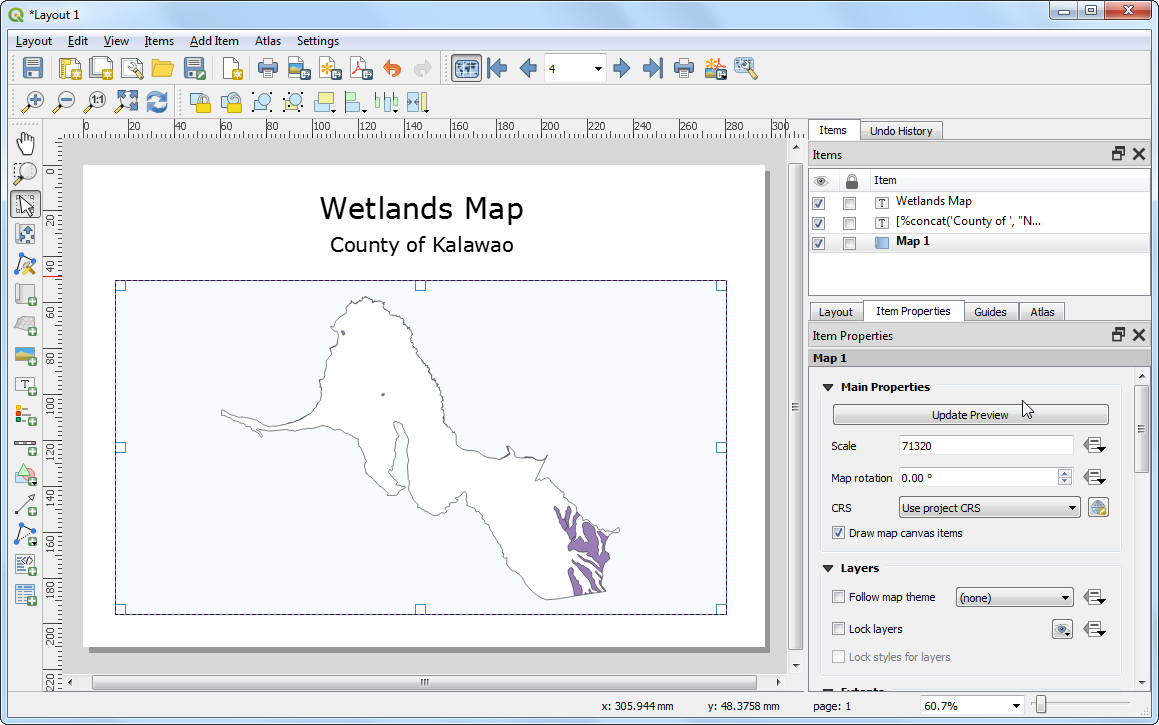
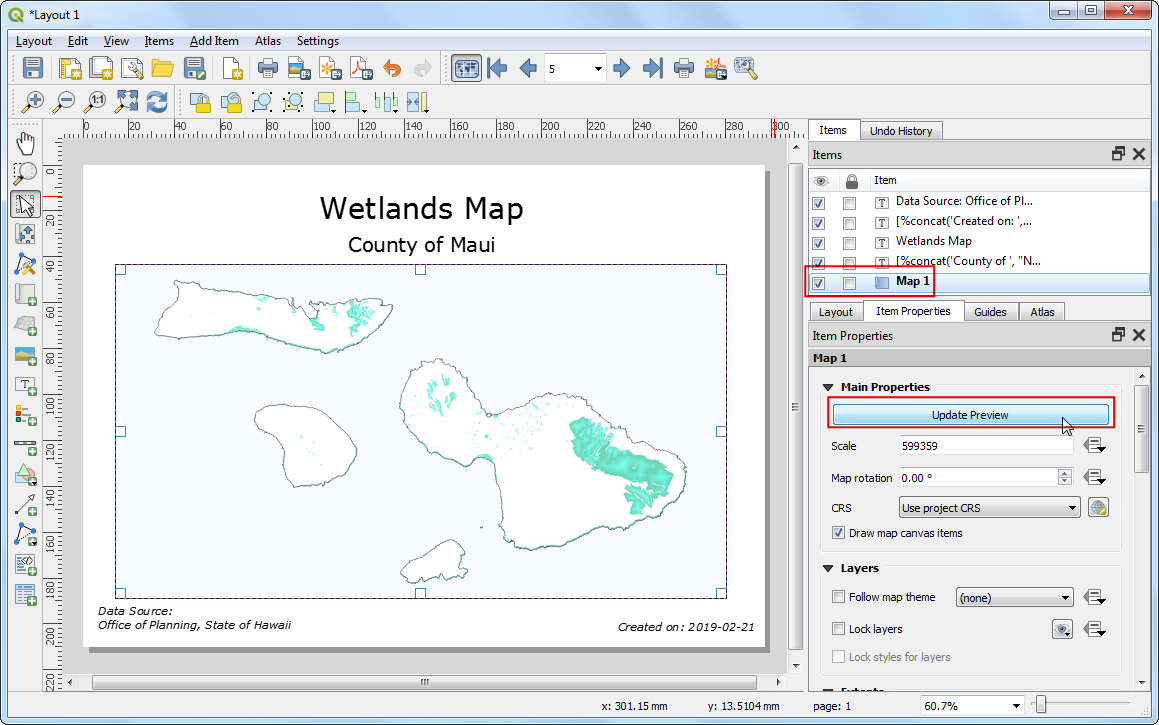
Close all intermediate dialogs and switch back to the Layout window. Select Map 1 item and click the Update preview button under Item properties tab to see the changes. Notice that now only the area covering the county boundary is shown.
Notă
If you do not see the Update preview button, it may help to select another Item element first and then select Map 1 again.
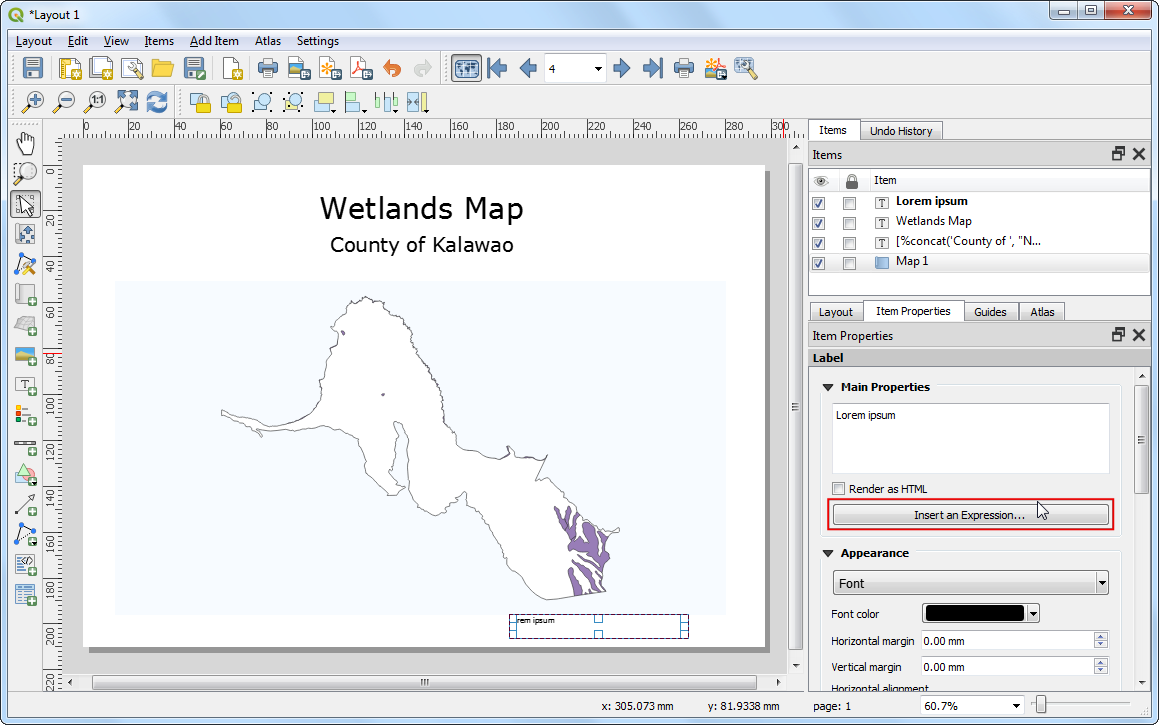
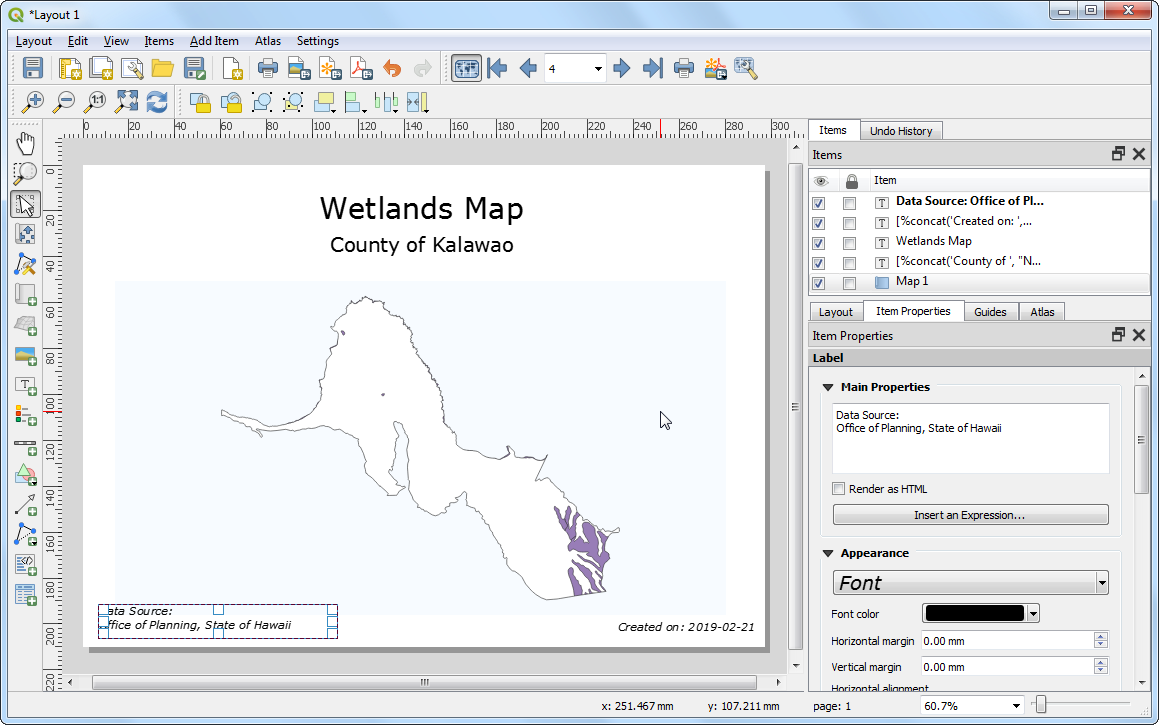
We will now add another dynamic label to show the current date. Go to and select the area on the map. Click Insert an expression button.
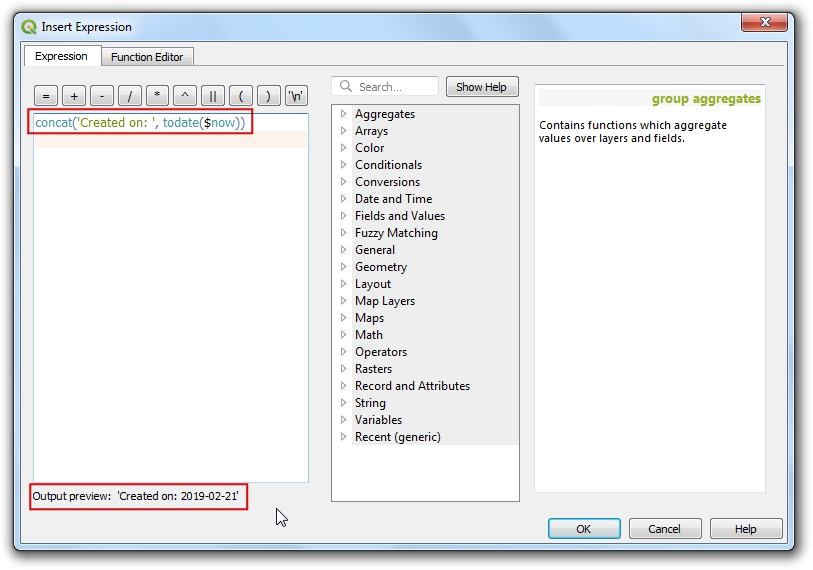
Expand the Date and Time functions group and you will find the
$nowfunction. This holds the current system time. The functiontodate()will convert this to a date string. Enter the expression as below and click OK.
concat('Created on: ', todate($now))
Adăugați o altă etichetă, indicând sursa datelor. Puteți adăuga, de asemenea, alte elemente, cum ar fi o săgeată a nordului scara grafică etc., așa cum se descrie în tutorialul Crearea unei Hărți.
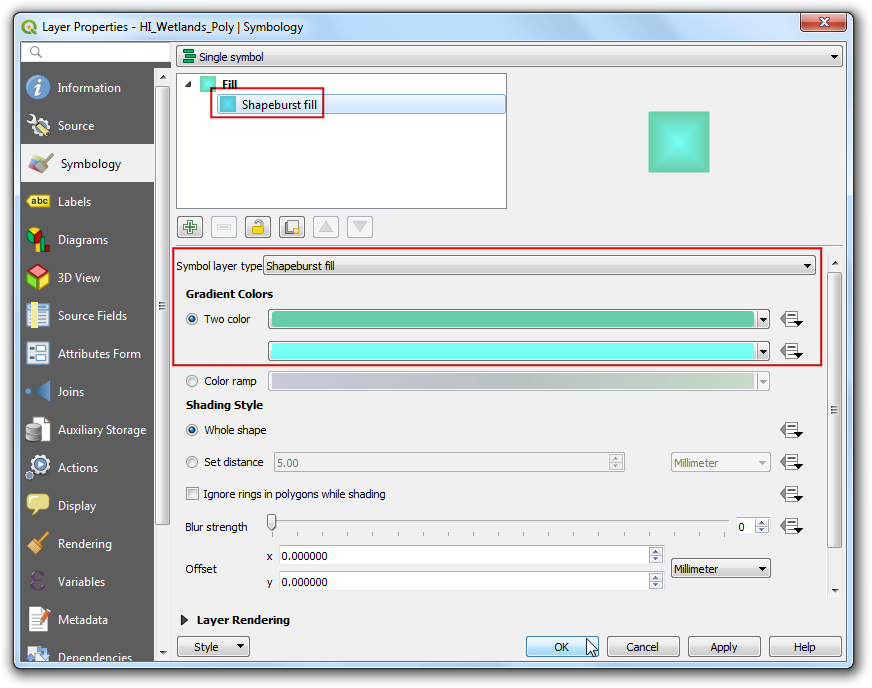
We will make one last styling improvement. Switch back to the main QGIS window and right-click the
HI_Wetlands_Polylayer and select Properties.
In the Symbology tab, click on Simple fill and select
Shapeburst fillas the Symbol layer type. Choose the Two color option and select shades of green and blue that you like. Click OK.
Select Map 1 item and click the Update preview button under Item properties tab to see the changes.
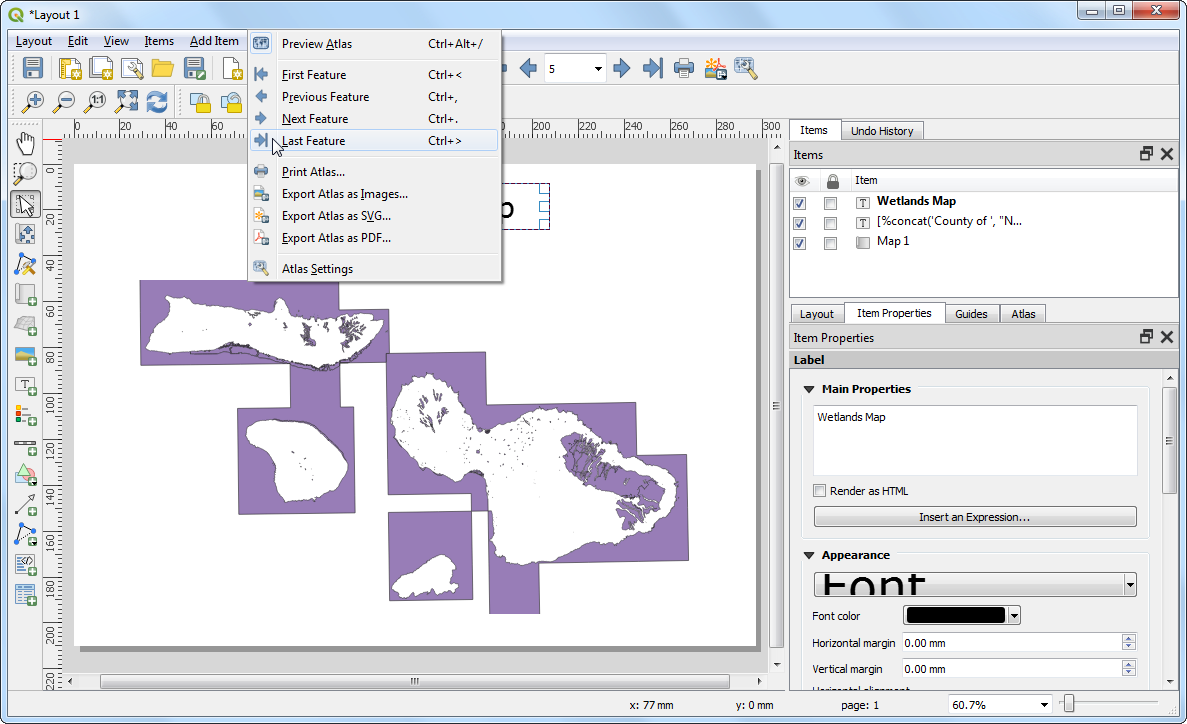
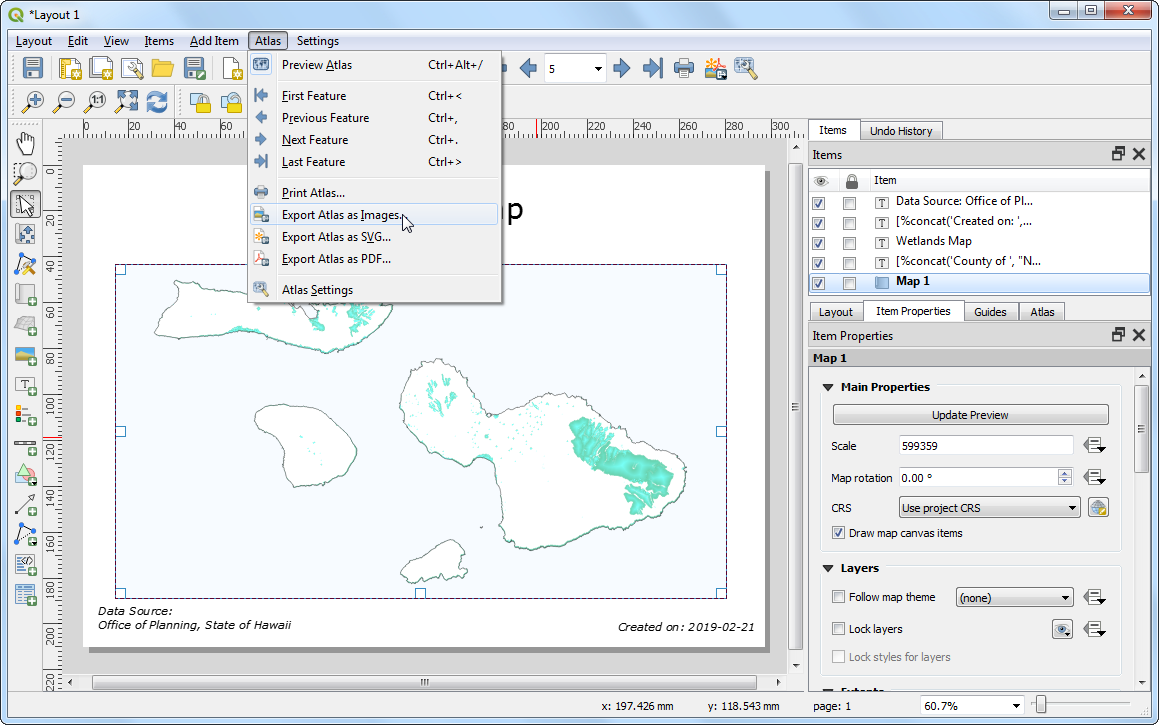
O dată ce vă place aspectul hărții, accesați .
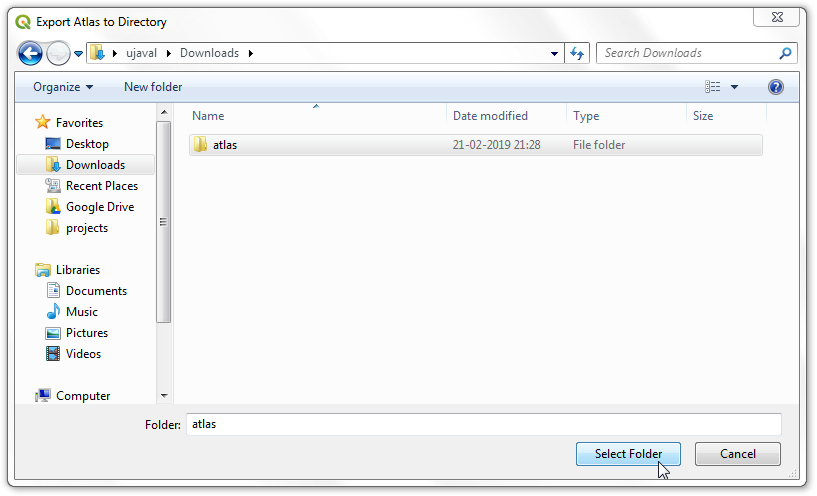
Selectați un director de pe calculatorul dumneavoastră, apoi faceți clic pe Alegere.
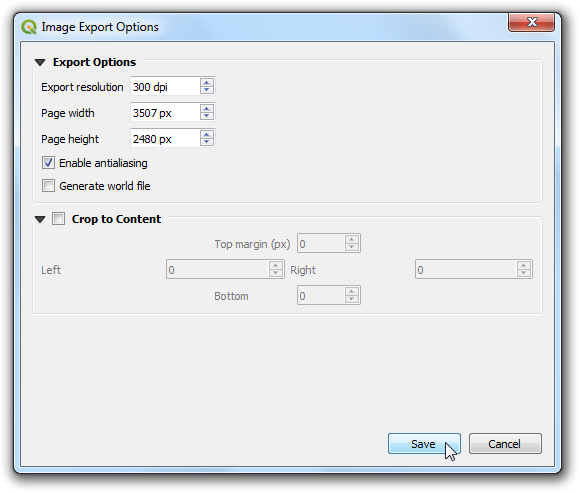
Leave the default options in the Image Export Options and click Save.
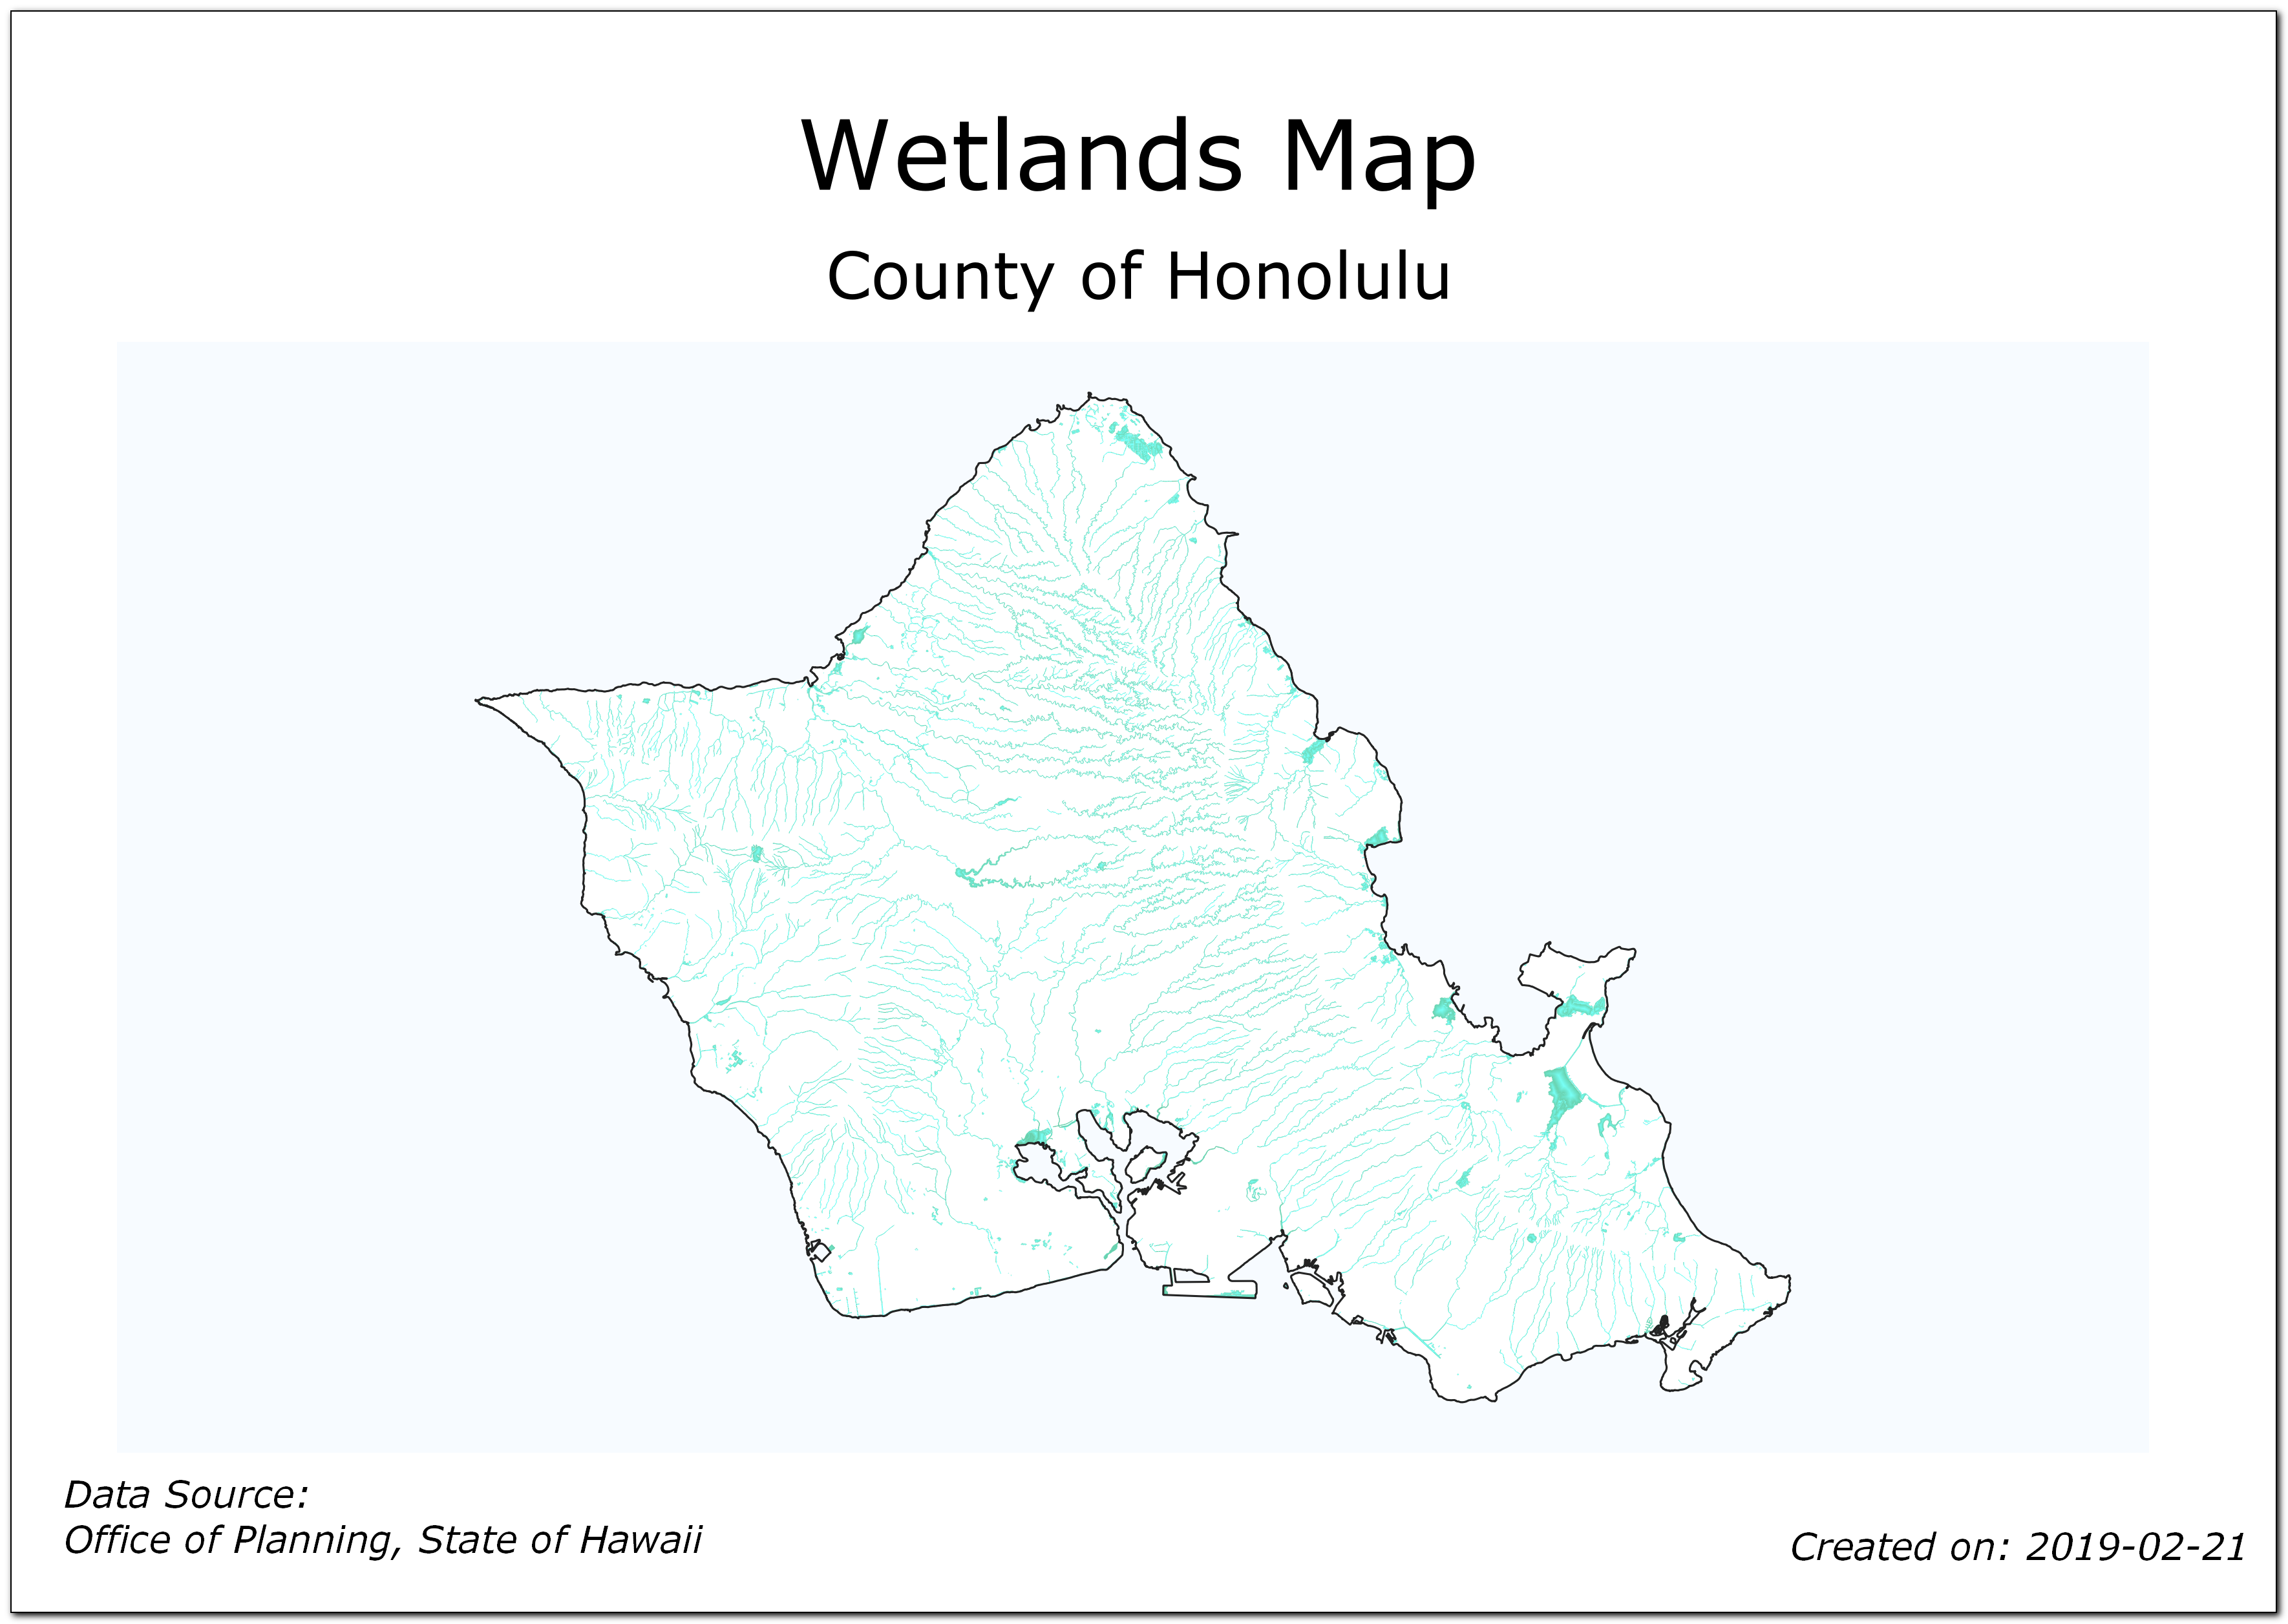
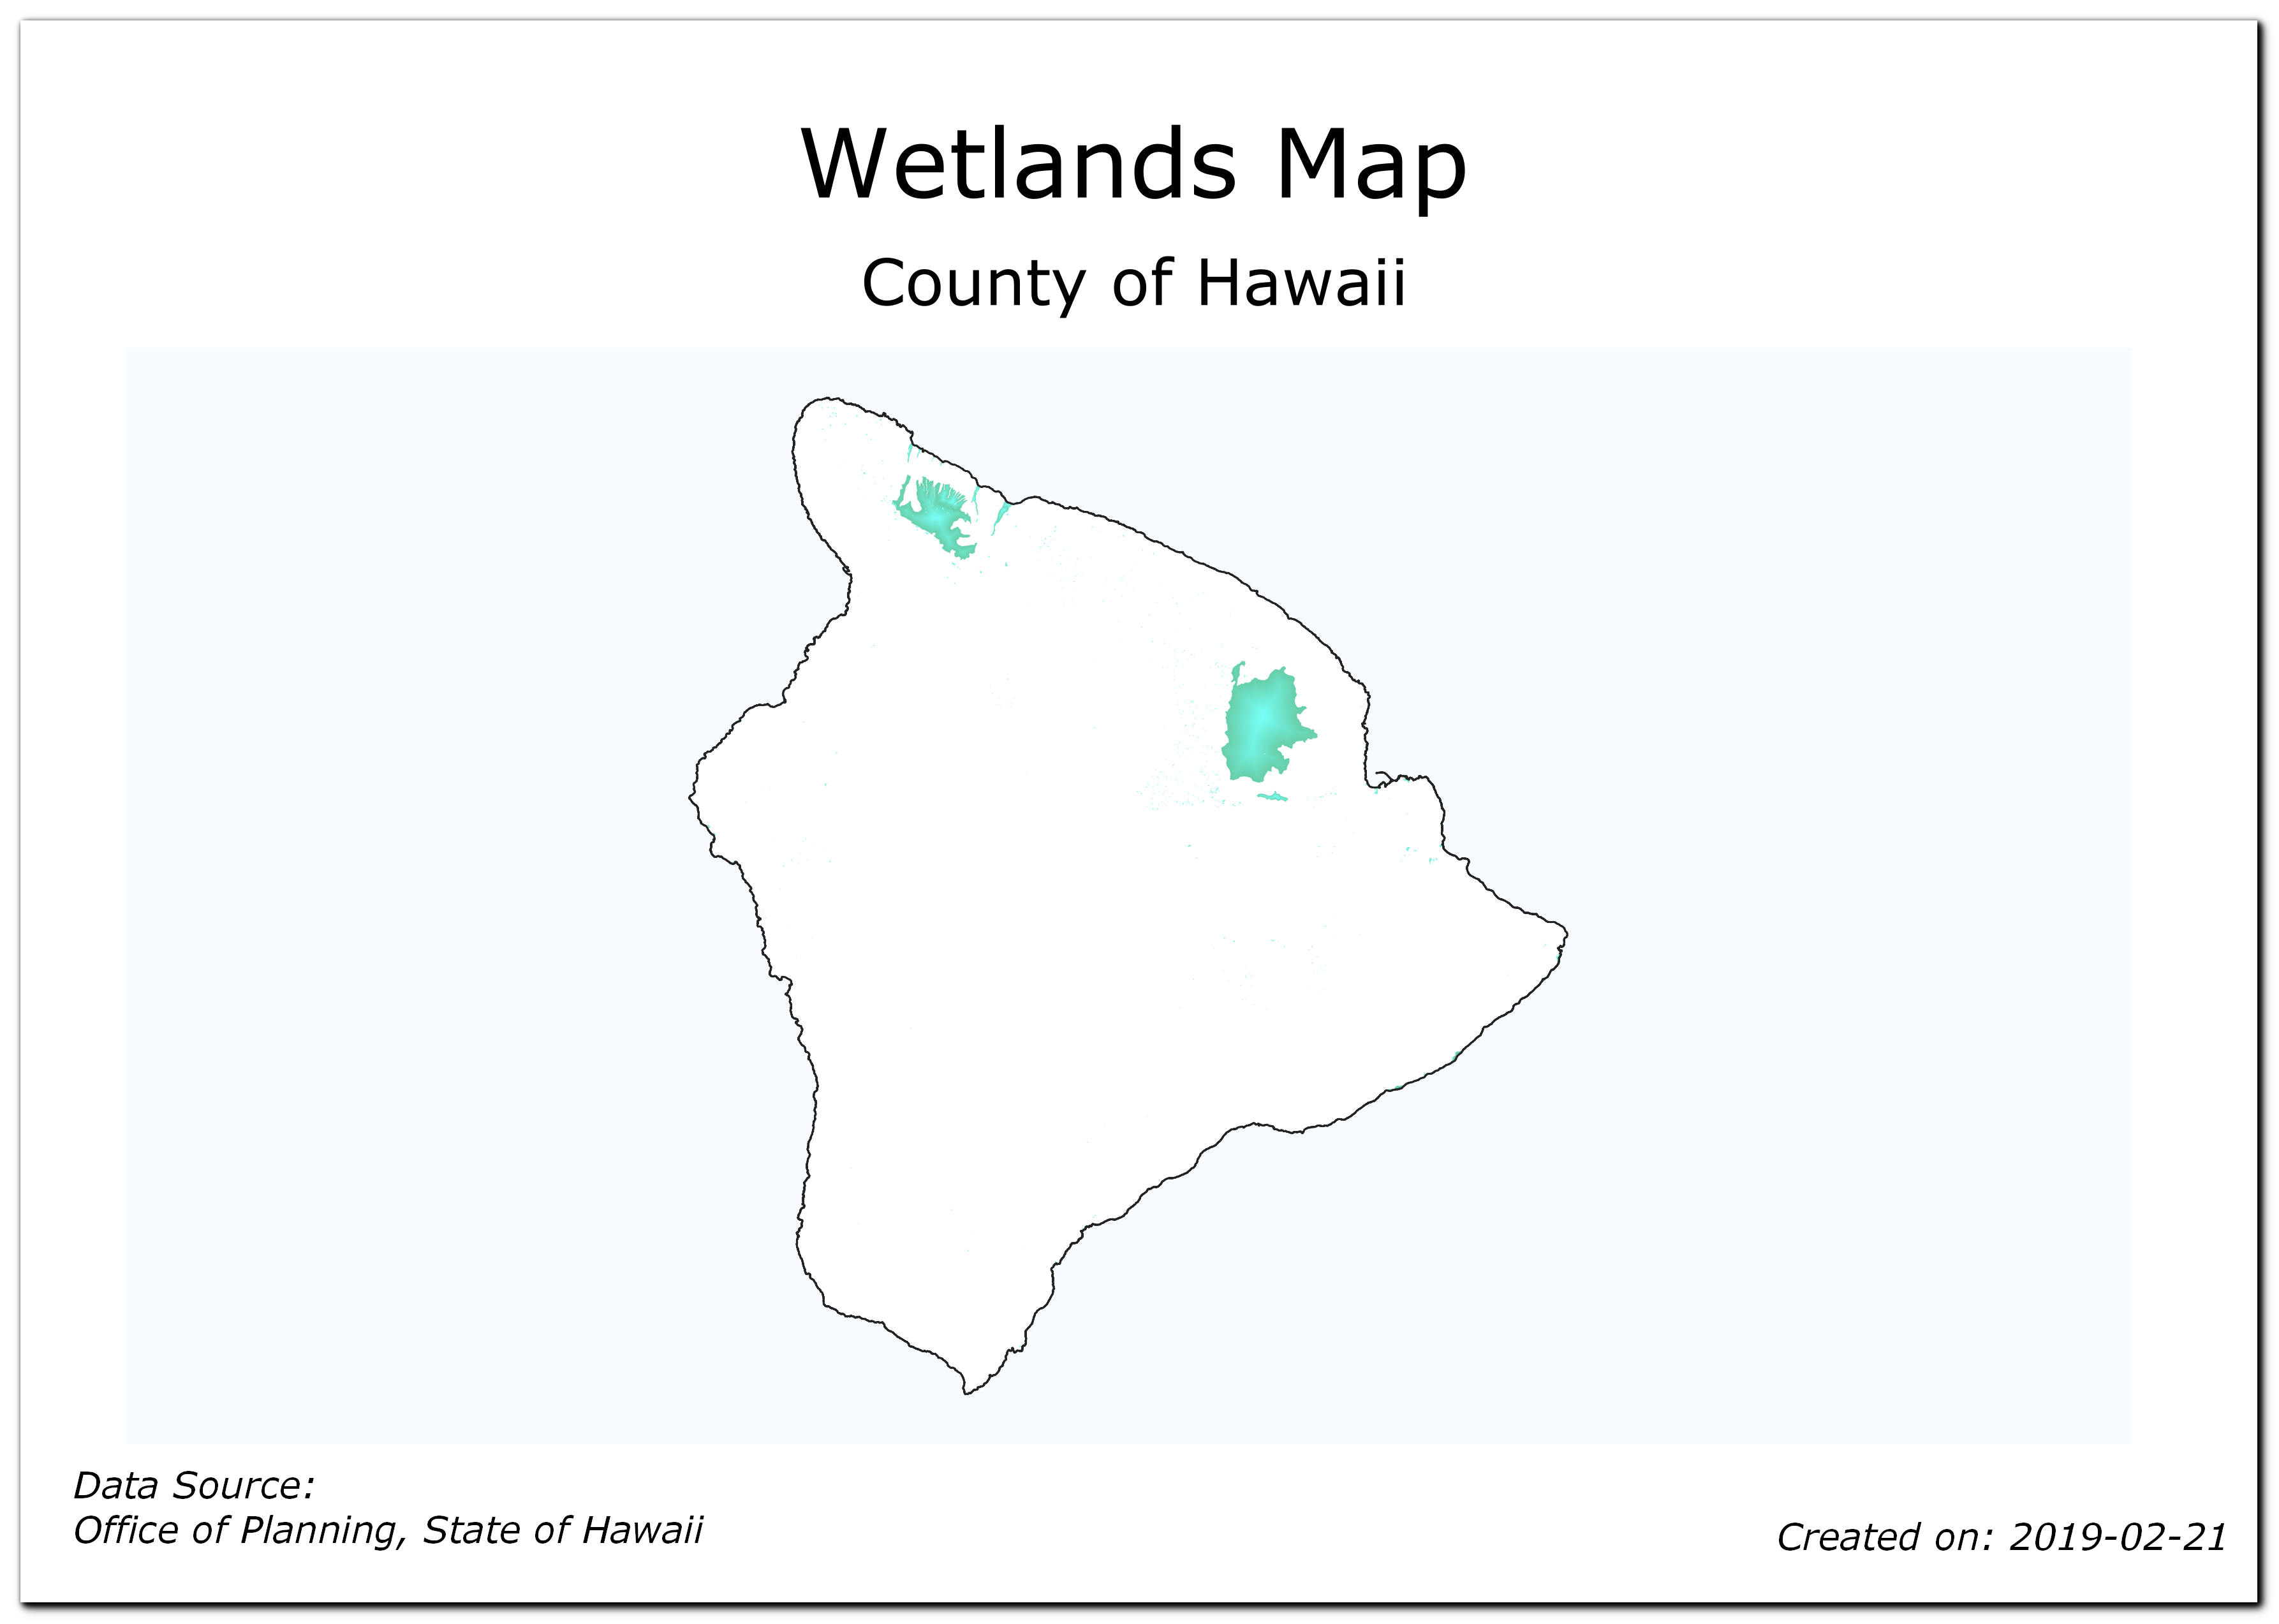
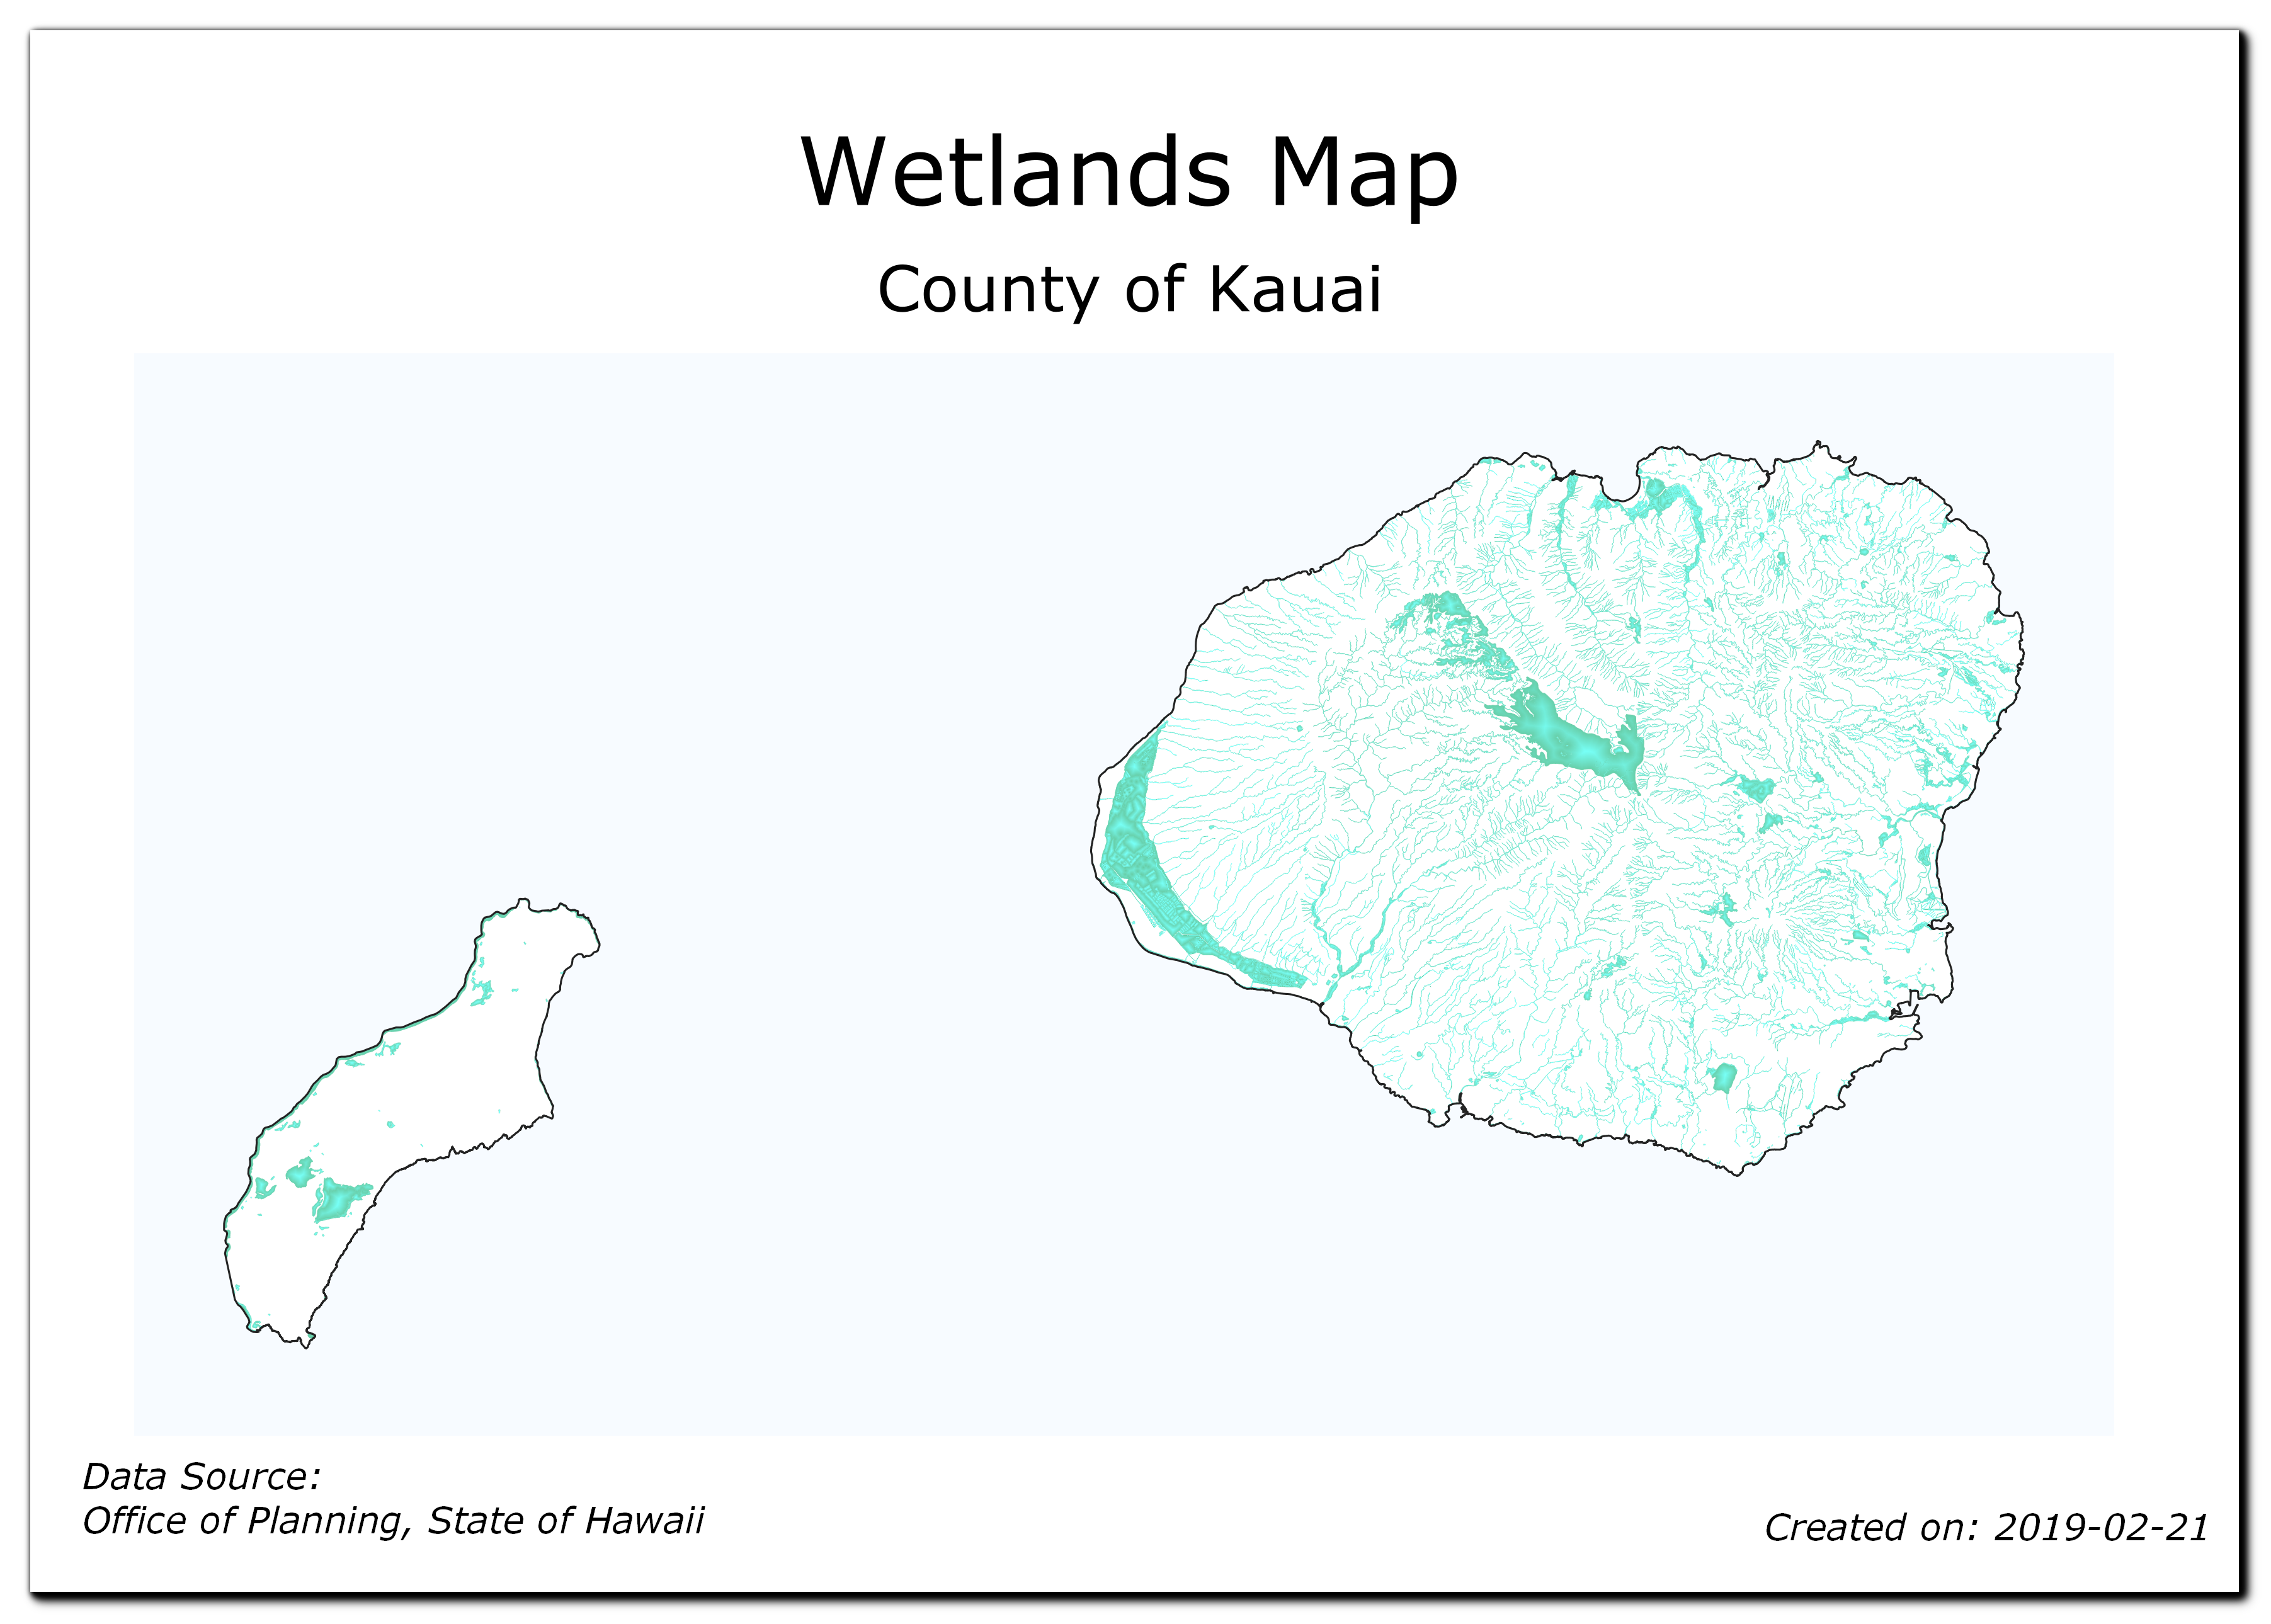
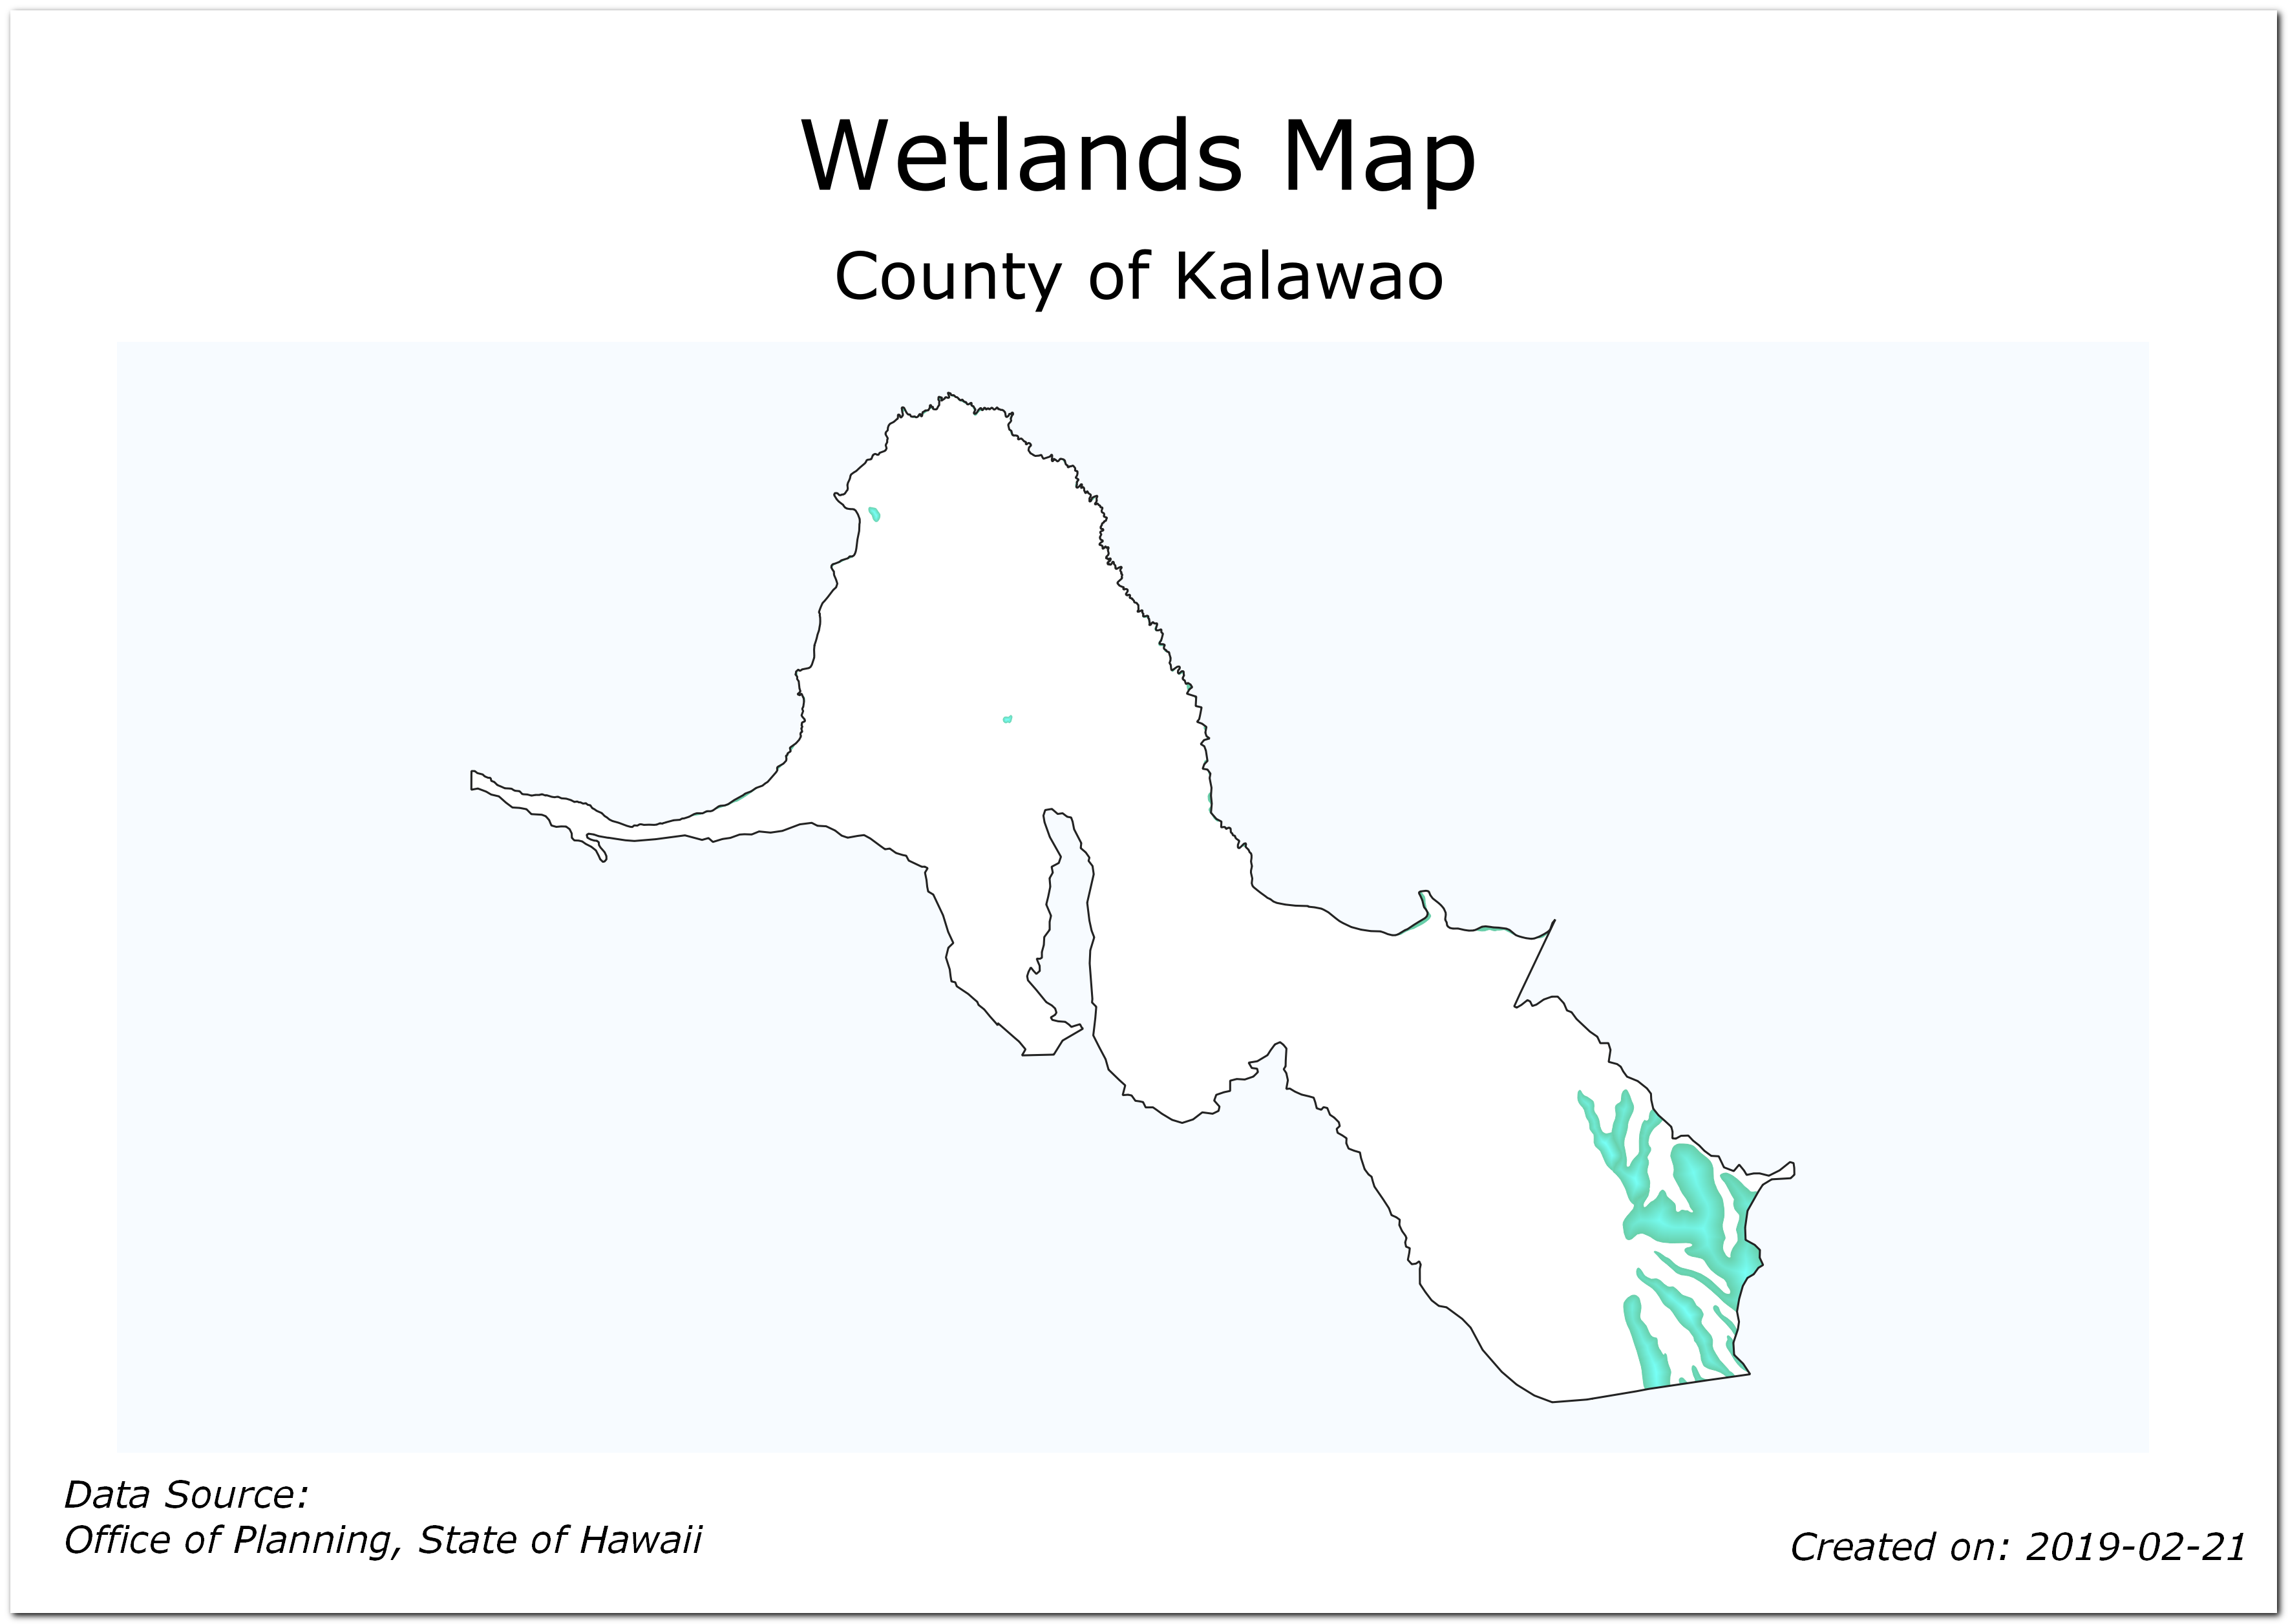
Instrumentul Atlas va parcurge fiecare element din stratul de acoperire, după care crea imagini separate ale hărții, pe baza modelului creat. Puteți vedea imaginile în director, o dată ce procesul s-a încheiat.
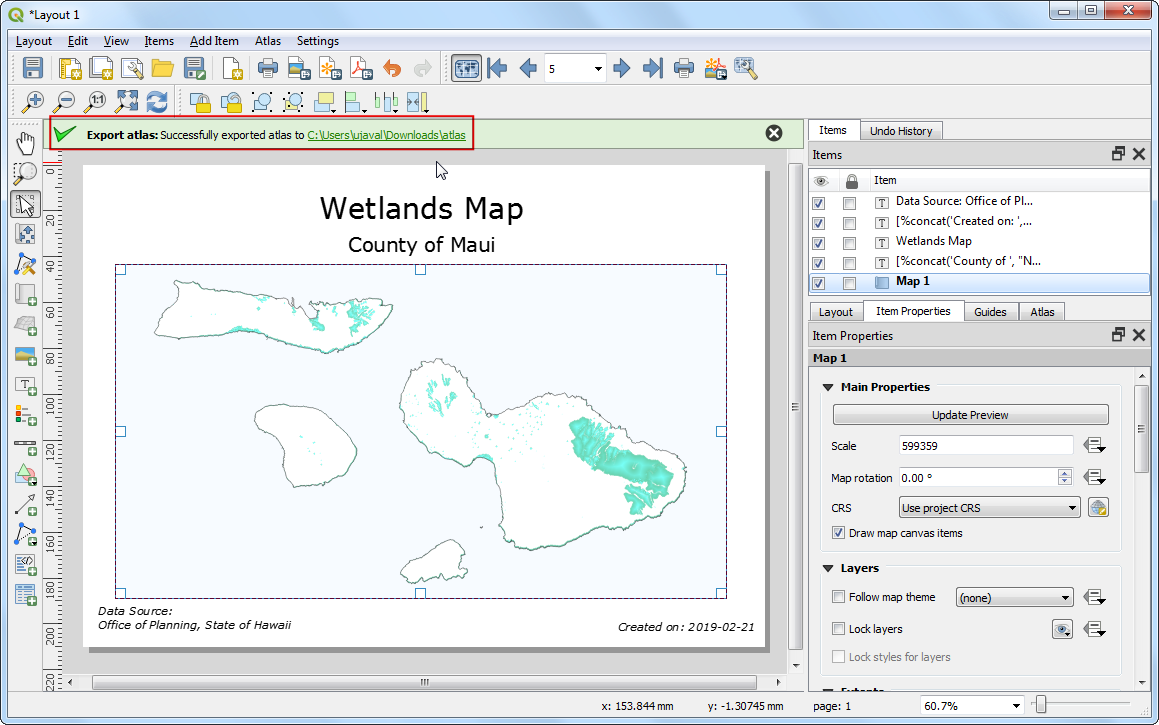
Aici sunt imaginile de referință ale hărții.
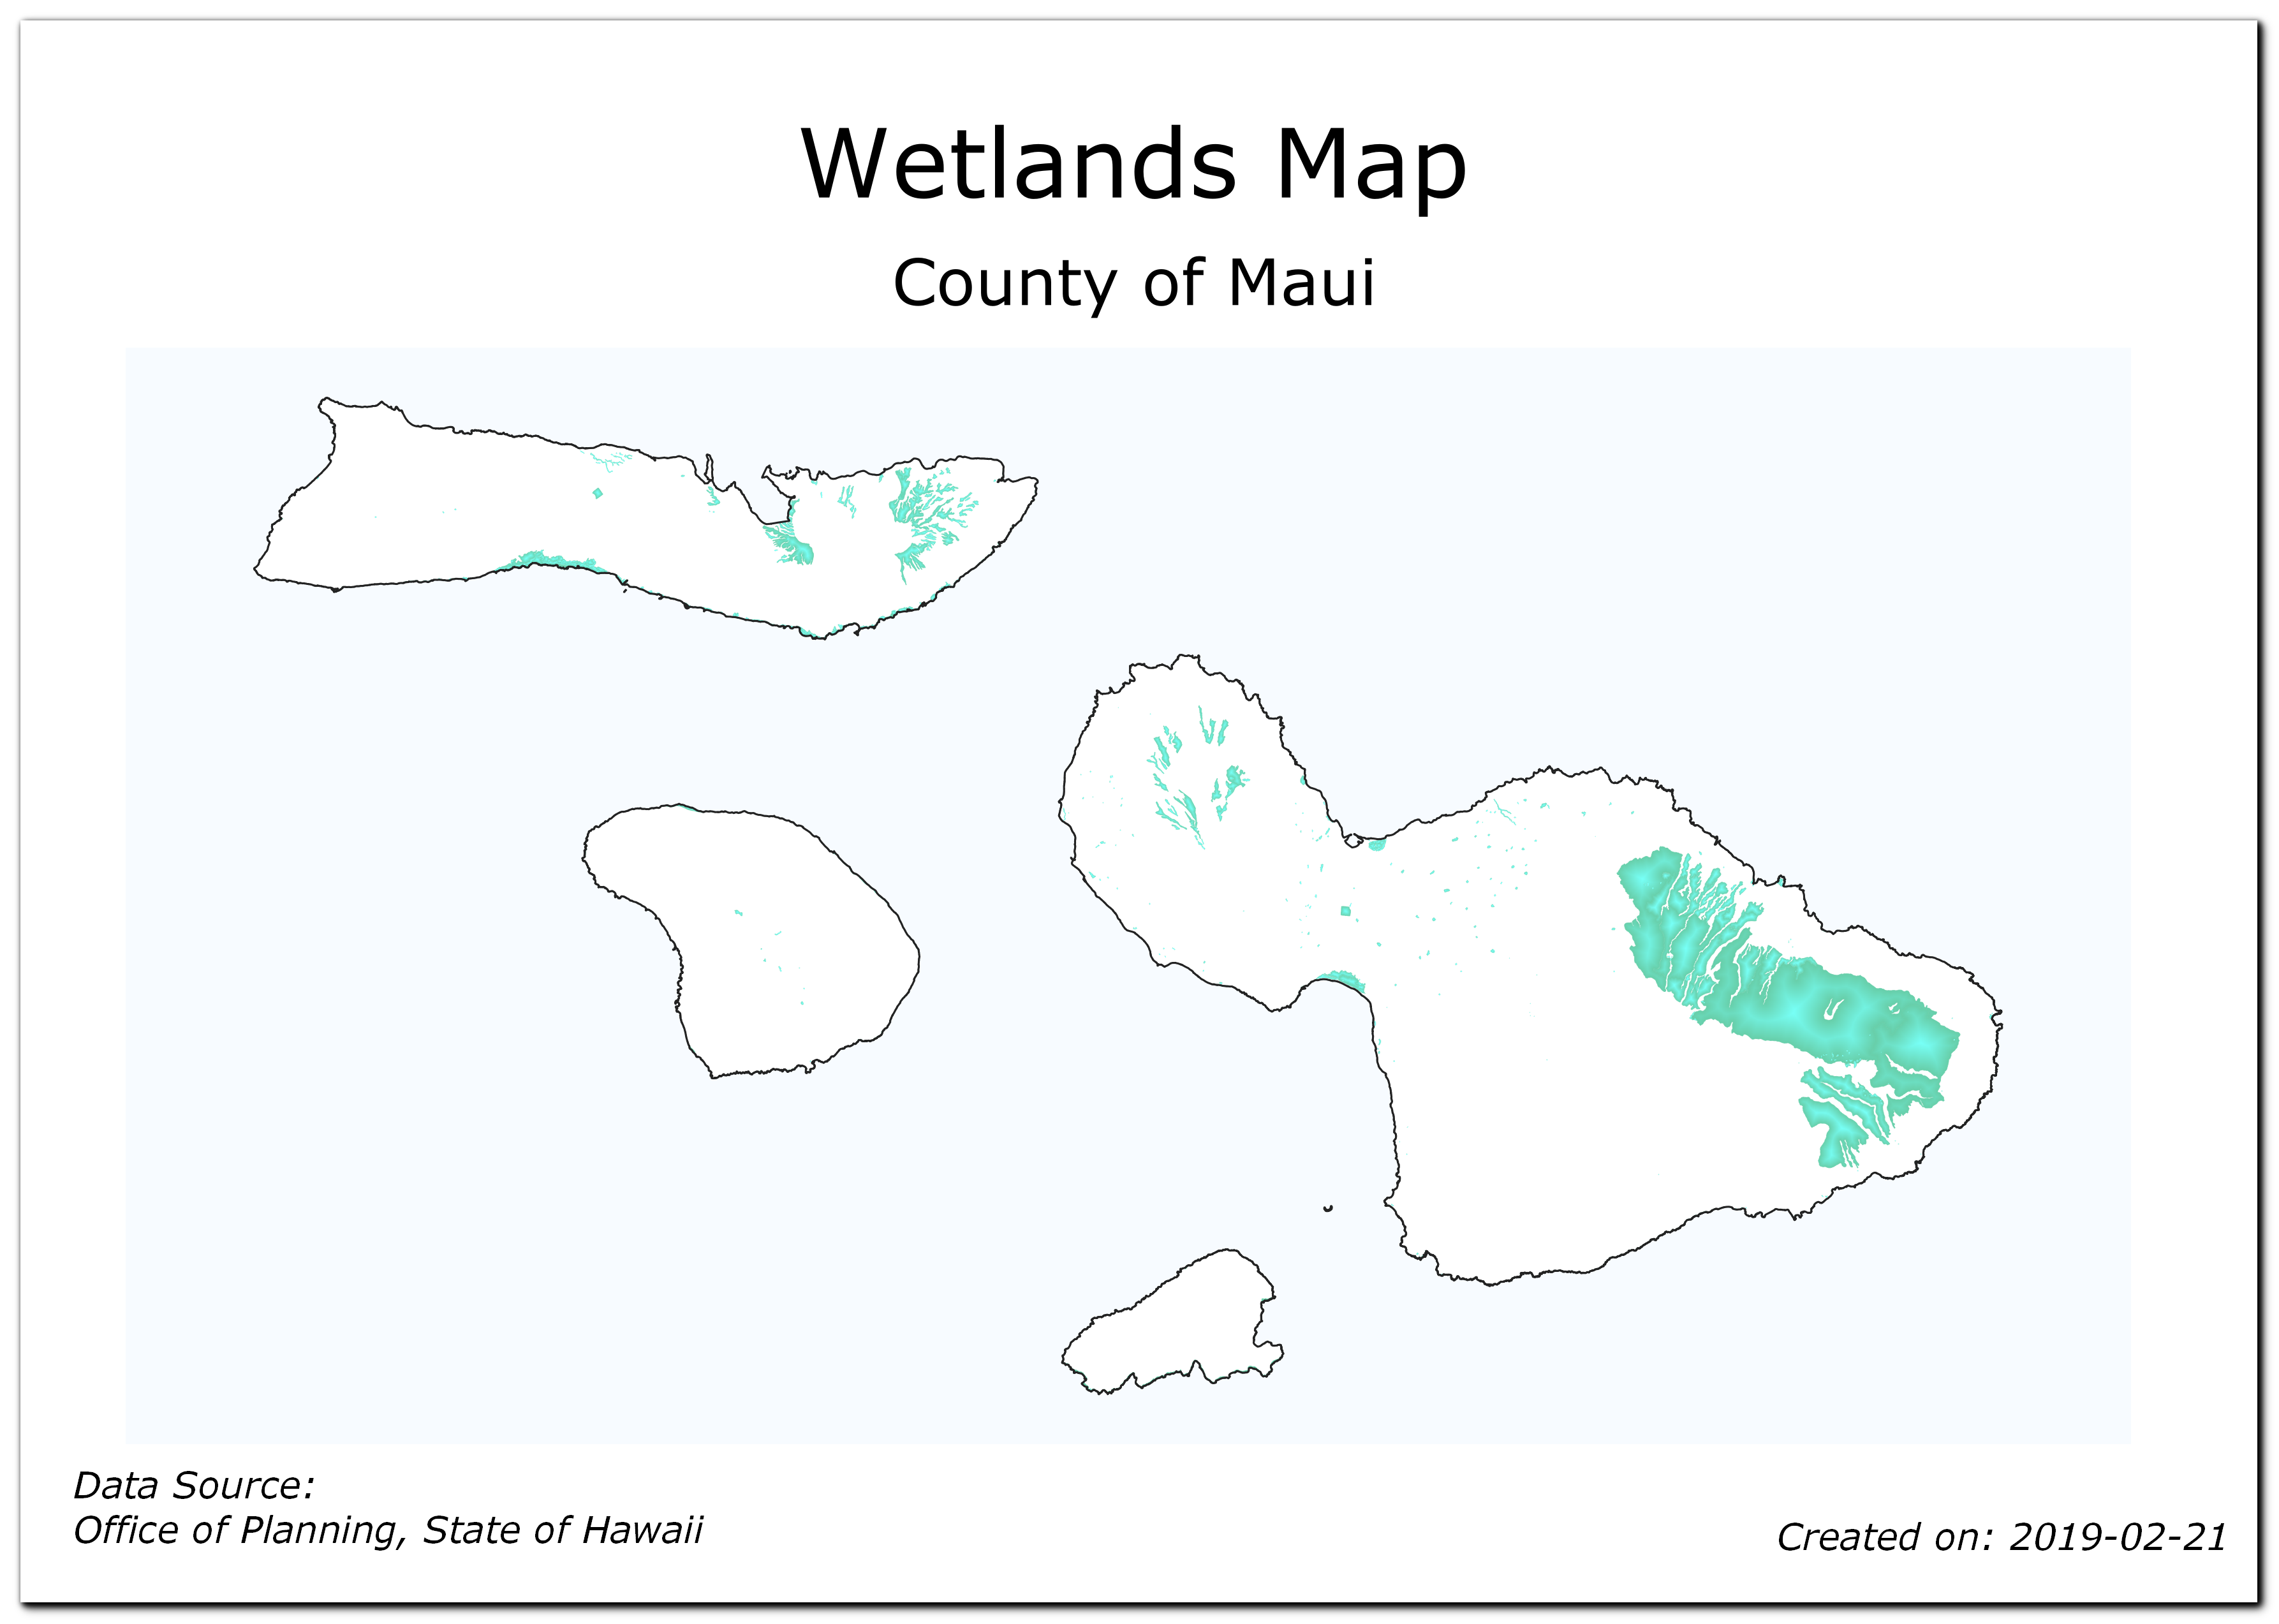
If you want to give feedback or share your experience with this tutorial, please comment below. (requires GitHub account)