 Ujaval Gandhi
Digitizing Map Data (QGIS3)
Digitizing is one of the most common tasks a GIS Specialist has to do. Often a large amount of GIS time is spent digitizing raster data to create vector layers that you use in your analysis. QGIS has powerful on-screen digitizing and editing capabilities that we will explore in this tutorial.
Overview of the task
We will use a raster topographic map and create several vector layers representing features around a park.
Other skills you will learn
Building pyramids for large raster datasets to speed up zoom and pan operations.
Create and edit GeoPackage.
Get the data
Land Information New Zealand (LINZ) provides raster topographic maps at 1:50,000 scale for the New Zealand mainland and Chatham Islands.
Download the GeoTIFF Image file from the Christchurch Topo50 map download page.
For convenience, you may directly download a copy of the dataset from the link below:
Data Source [LINZ]
Procedure
In QGIS, let’s load the image file. Go to .
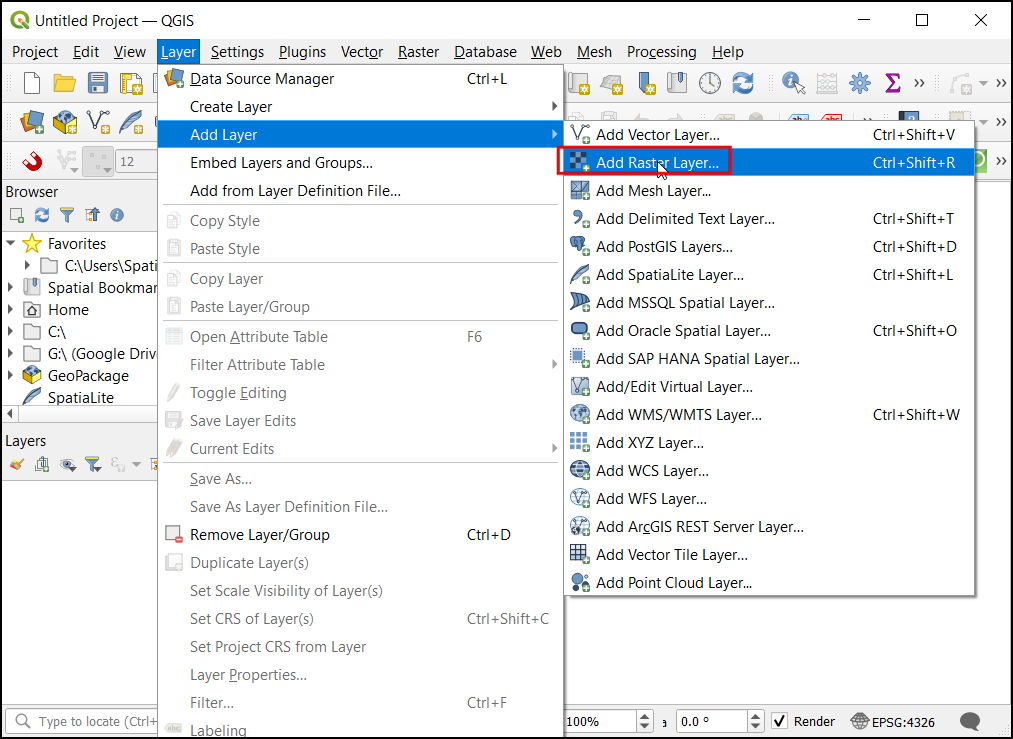
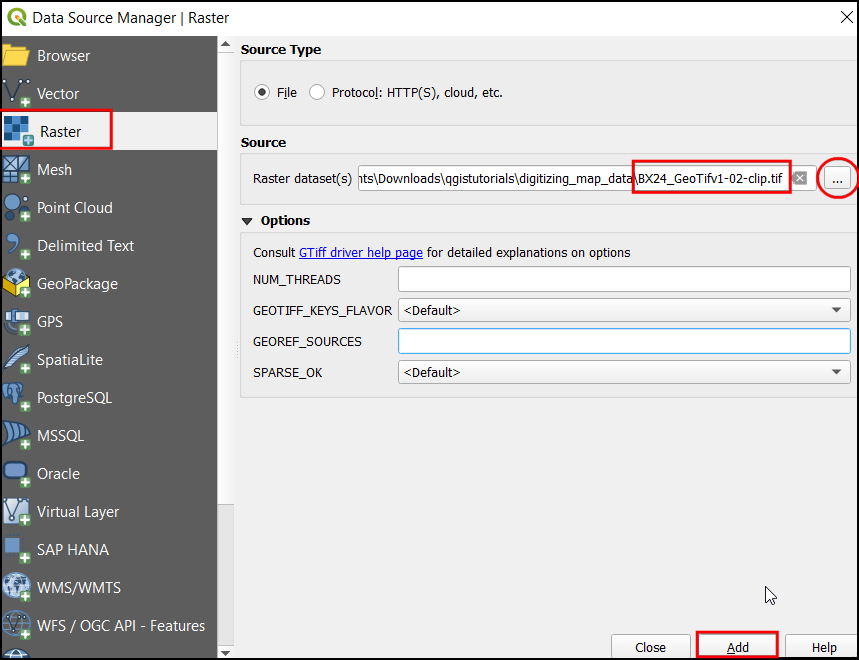
In the Data Source Manager dialog select Raster. Under Source click on the
...and locate the downloadedBX24_GeoTifv1-02.tifand click Open. Then click Add followed by Close.
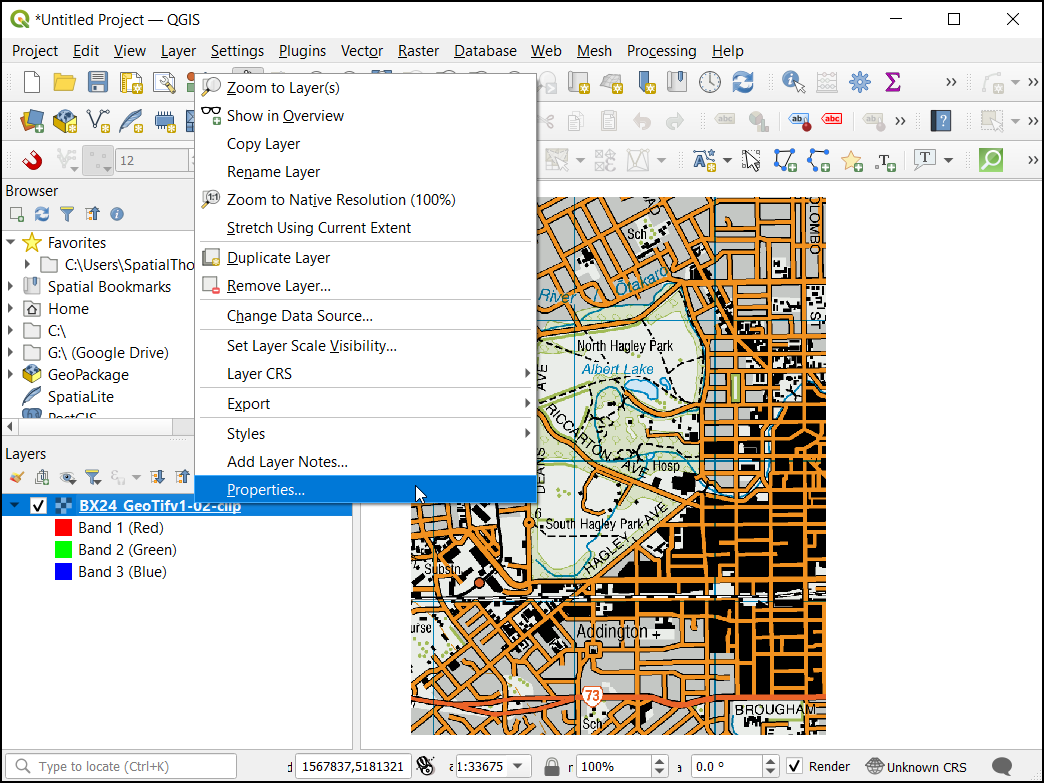
This is a large raster file, and you may notice that when you zoom or pan around the map, the map takes a little time to render the image. QGIS offers a simple solution to make rasters load much faster by using Image Pyramids. QGIS creates pre-rendered tiles at different resolutions, and these are presented to you instead of the full raster. This makes map navigation snappy and responsive. Right-click the
BX24_GeoTifv1-02layer and choose Properties.
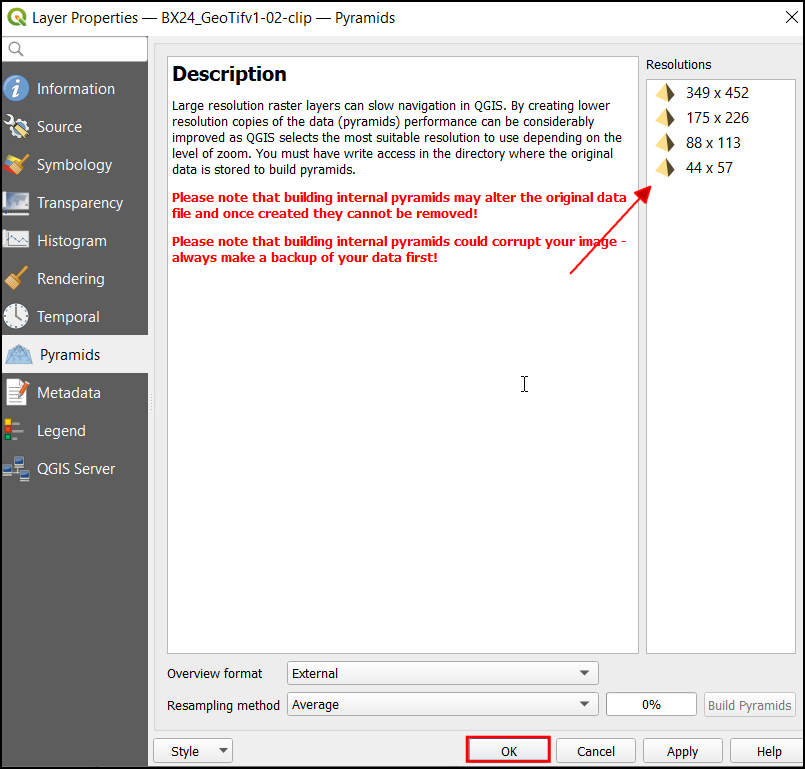
In the Layer Properties dialog, Choose the Pyramids tab. Hold the Ctrl key and select all the resolutions offered in the Resolutions panel. Leave other options to defaults and click Build pyramids.
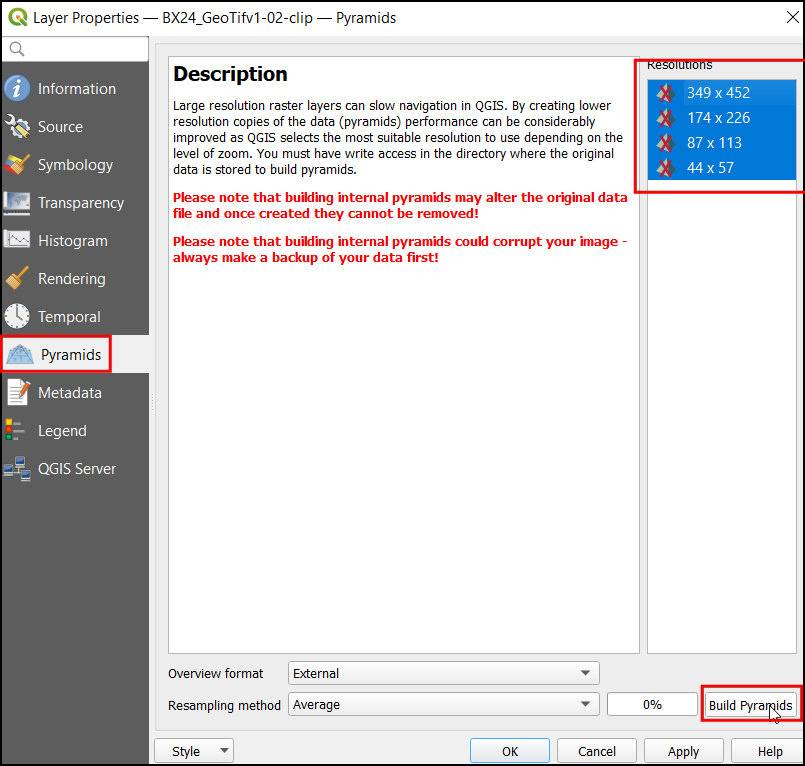
Once the process finishes, the dialog box will show the pyramids without a cross. This indicates the Image Pyramids build is completed. Click OK.
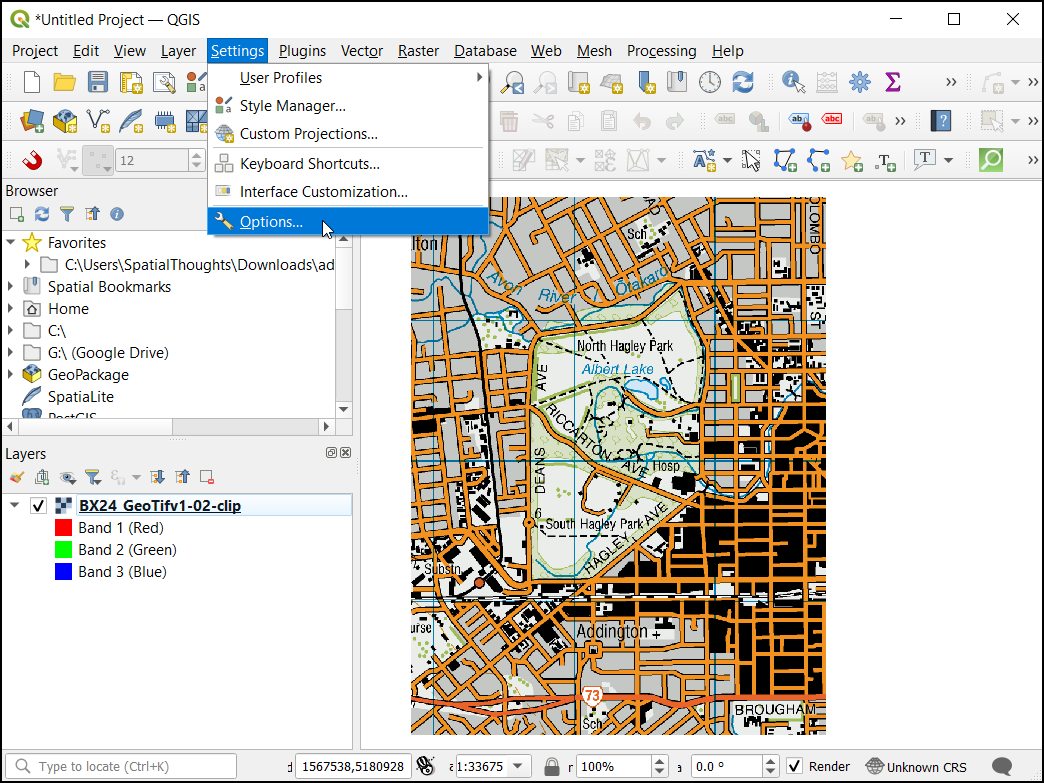
Before we start, we need to set default Digitizing Options. Go to .
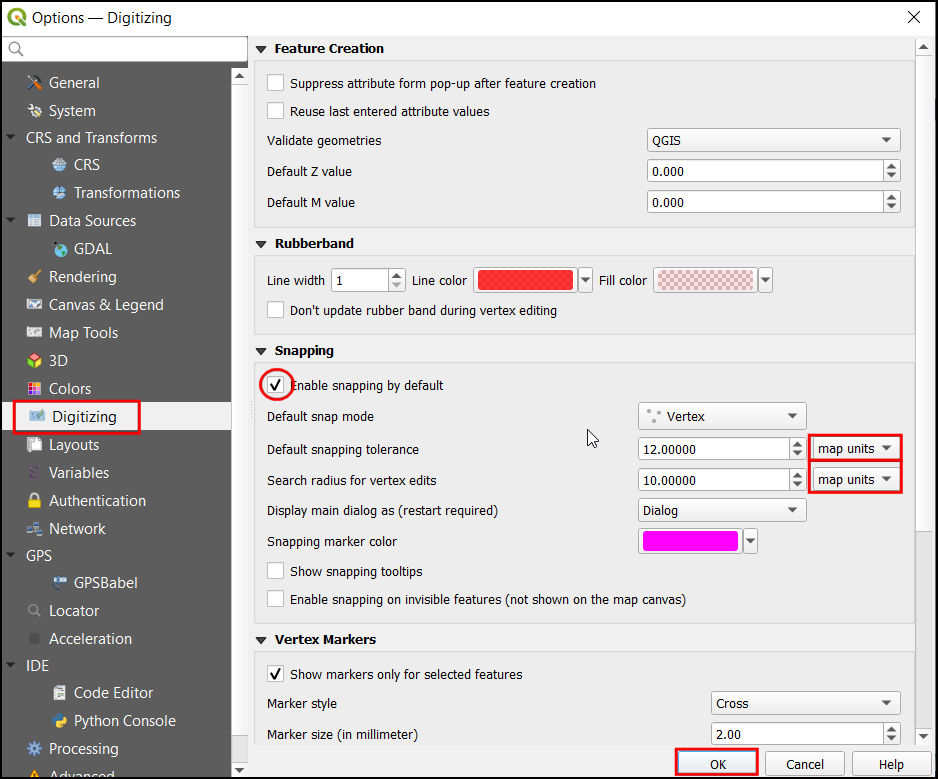
Select the Digitizing tab in the Options dialog. Check the Enable snapping by default under Snapping section. In Default snap mode choose Vertex. This will allow you to snap to the nearest vertex. I also prefer to set the Default snapping tolerance and Search radius for vertex edits in pixels instead of map units. This will ensure that the snapping distance remains constant regardless of zoom level. Depending on your computer screen resolution, you may choose an appropriate value. Click OK.
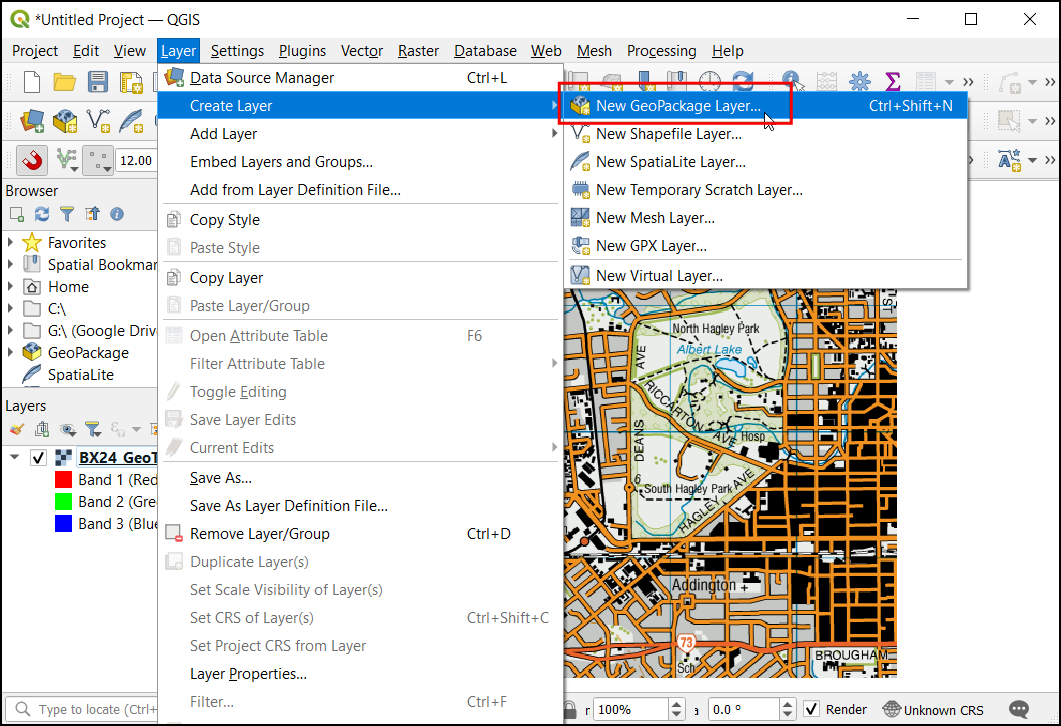
Now we are ready to start digitizing. We will first create a road layer and digitize the roads around the park area. Click icon from Panels. A GeoPackage is an open, non-proprietary, platform-independent, and standards-based data format for a geographic information system implemented as an SQLite database container. This makes it much easier to move it around instead of a bunch of shapefiles. In this tutorial, we create a couple of polygon layers and a line layer so that a GeoPackage will be better suited. You can always load a GeoPackage and export layers as a shapefile or any other format you want.
In the New GeoPackage Layer dialog, click the … button and save a new GeoPackage database named
digitizing.gpkg. Choose the Table name asRoadsand selectLineStringas the Geometry type. The base topographic map is theEPSG:2193 - NZGD 2000CRS.
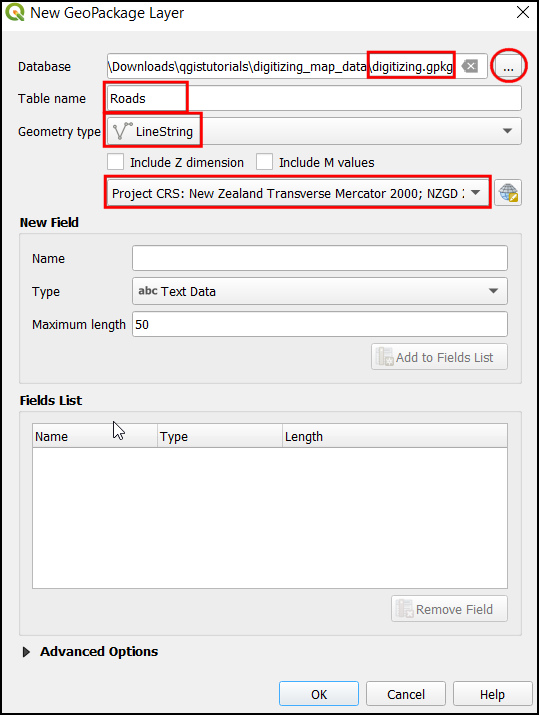
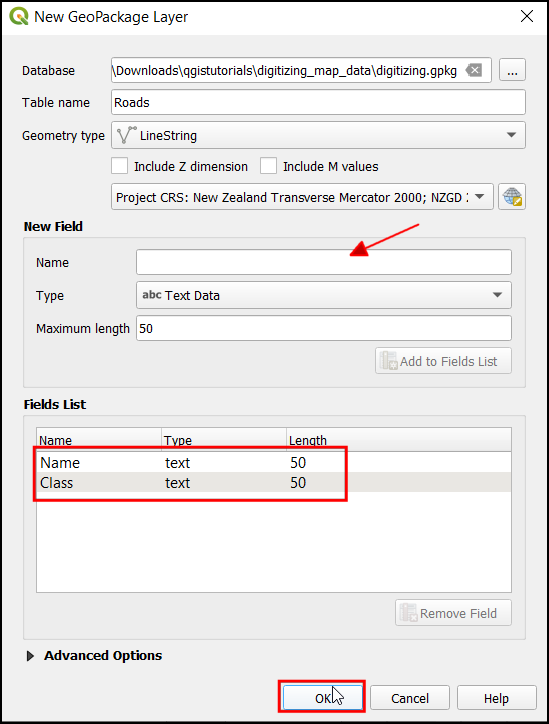
When creating a GIS layer, you must decide on each feature’s attributes. Since this is a road layer, we additionally will have two primary attributes - Name and Class. In New Field Enter
Nameof the type Text data, with50as Maximum length and click Add to attribute list. Now create a new attributeClassof the type Text data, with50as Maximum length. Click OK
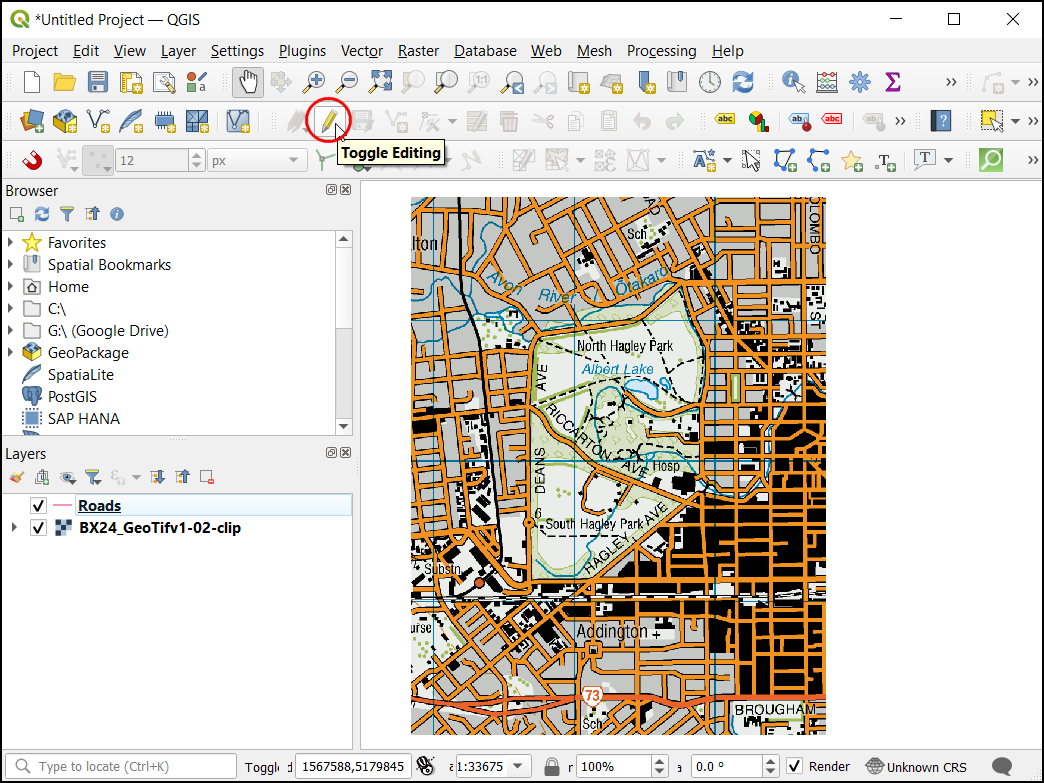
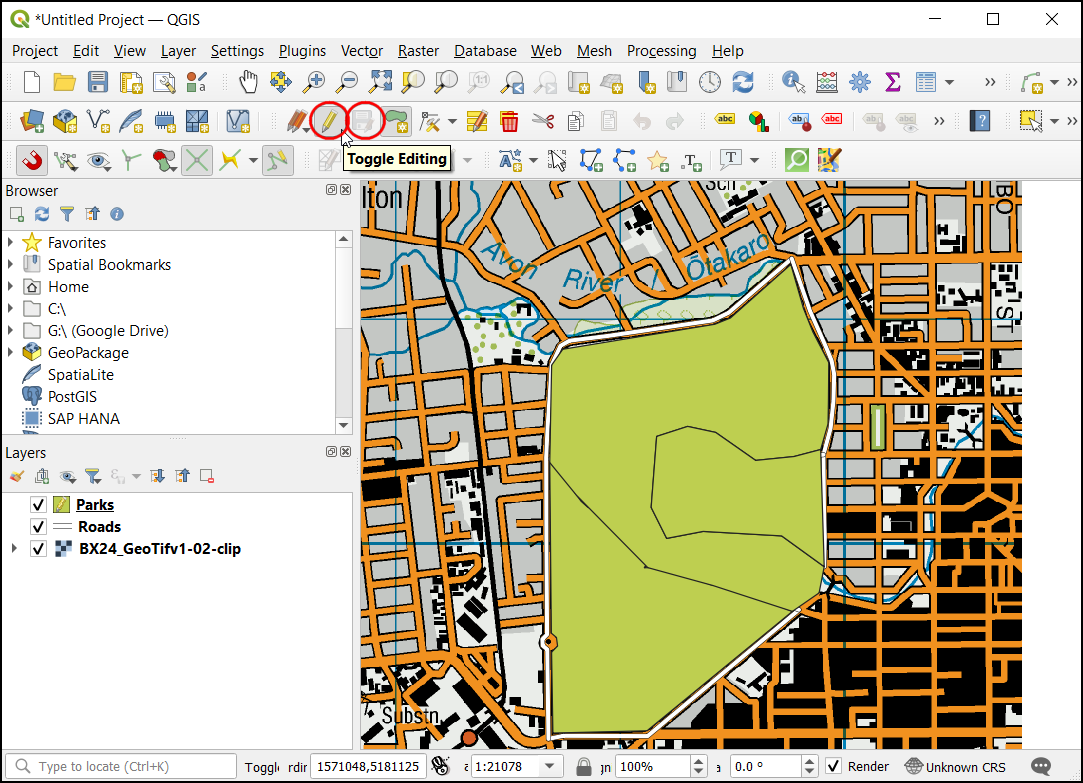
Once the
Roadslayer is loaded, click the Toggle Editing button to put the layer in editing mode.
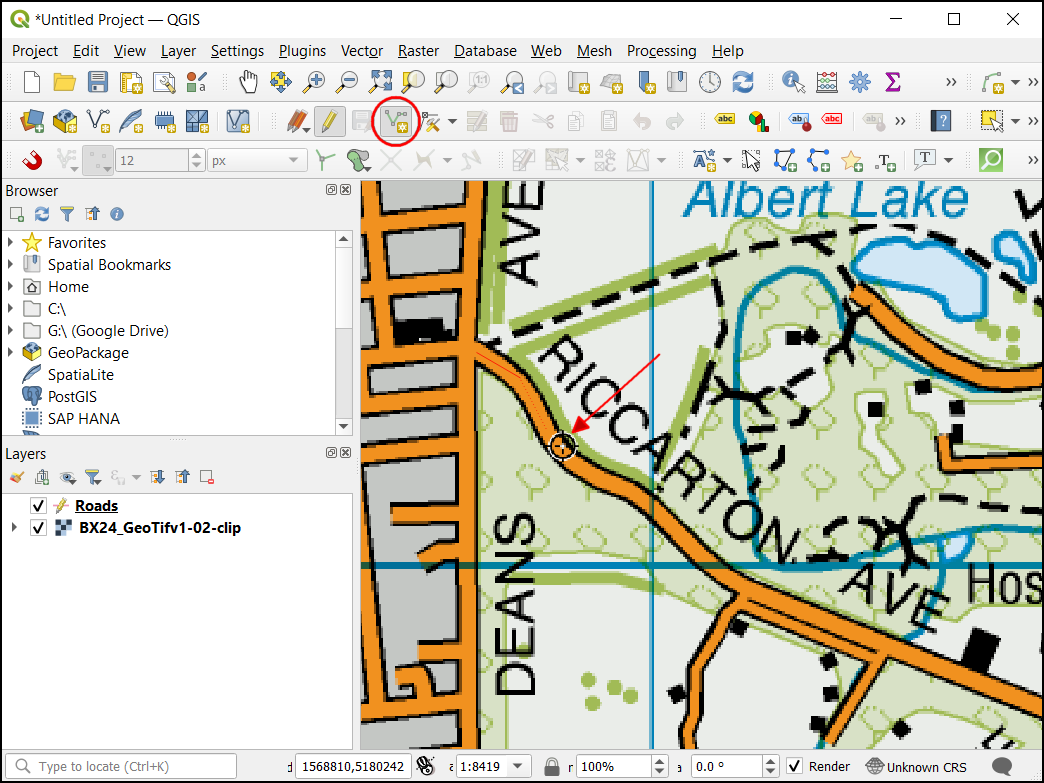
Click the Add Line Feature button. Click on the map canvas to add a new vertex. Add new vertices along with the road feature. Once you have digitized a road segment, right-click to end the feature.
참고
You can use the scroll wheel of the mouse to zoom in or out while digitizing. You can also hold the scroll button and move the mouse to pan around.
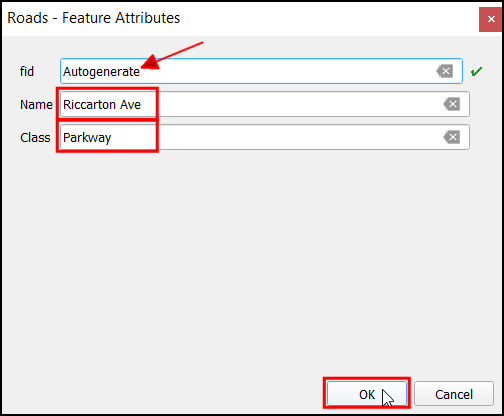
After you right-click to end the feature, you will get a pop-up dialog called Road - Feature Attributes. Here you can enter attributes of the newly created feature. Skip entering any value for fid as it is a sequential id that will be autogenerated. Enter the road name as it appears on the topo map. Optionally, assign a Road Class value as well. Click OK.
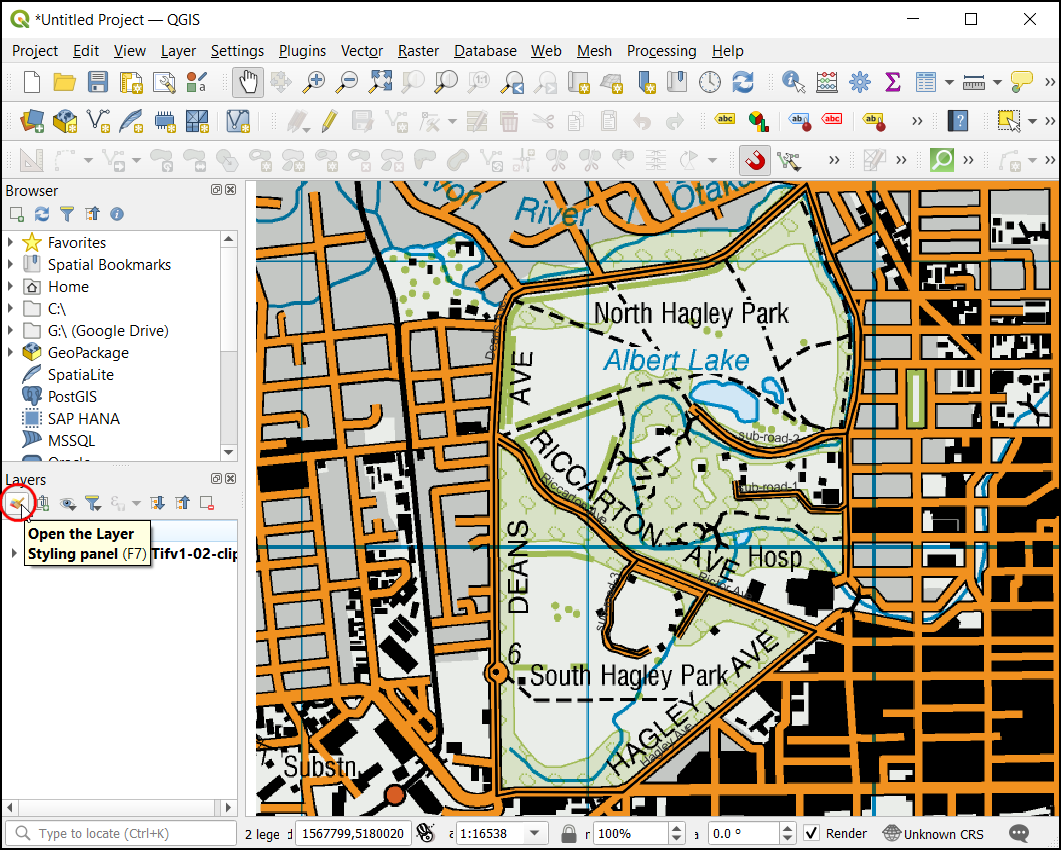
The default style of the new line layer is a thin line. Let’s change it to better see the digitized features on the canvas. Select the
Roadslayer and click Layer Styling Panel.
In the Layer Styling Panel, search for different road layer styles. Select
topo road. Click OK.
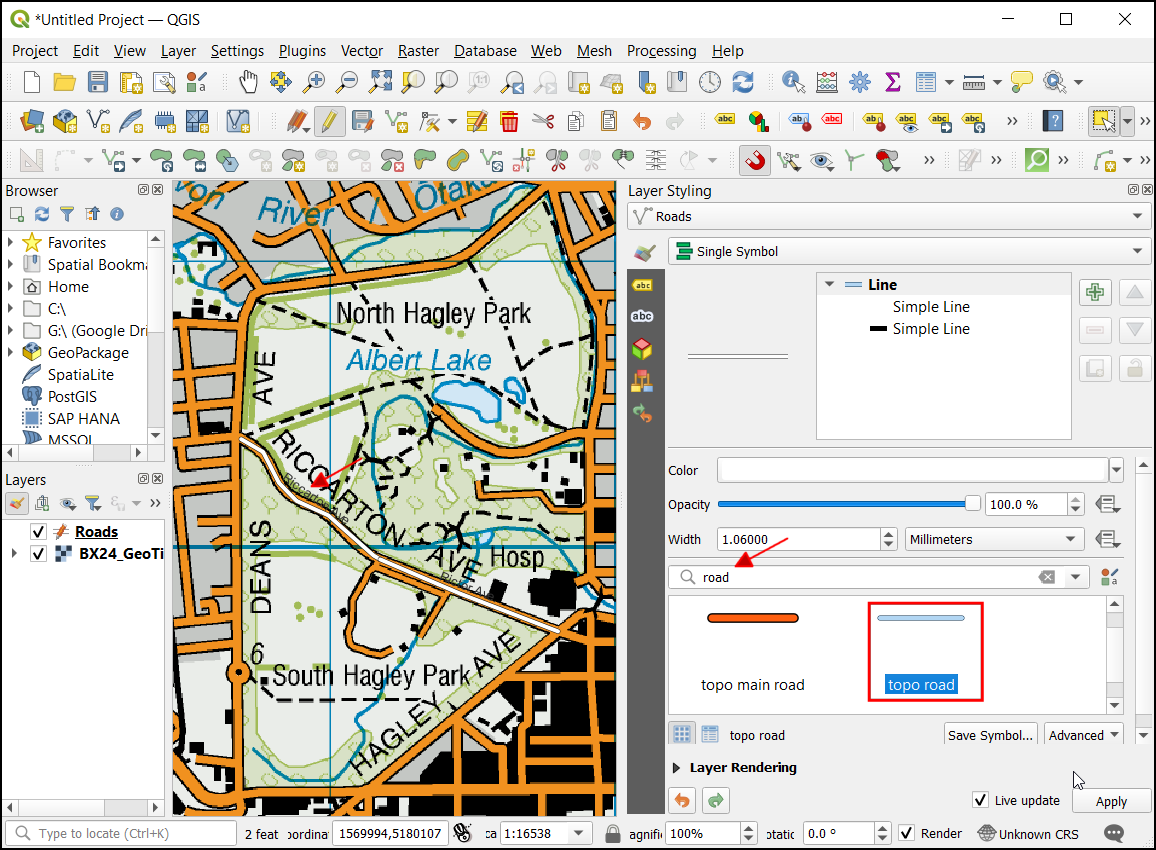
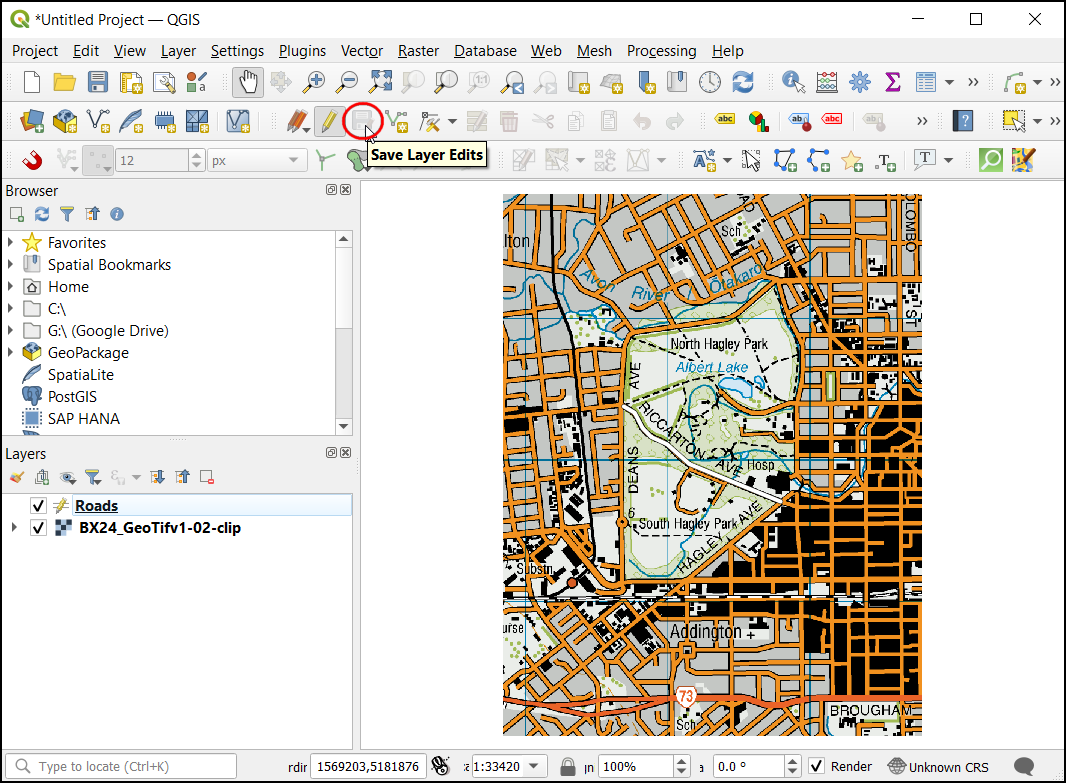
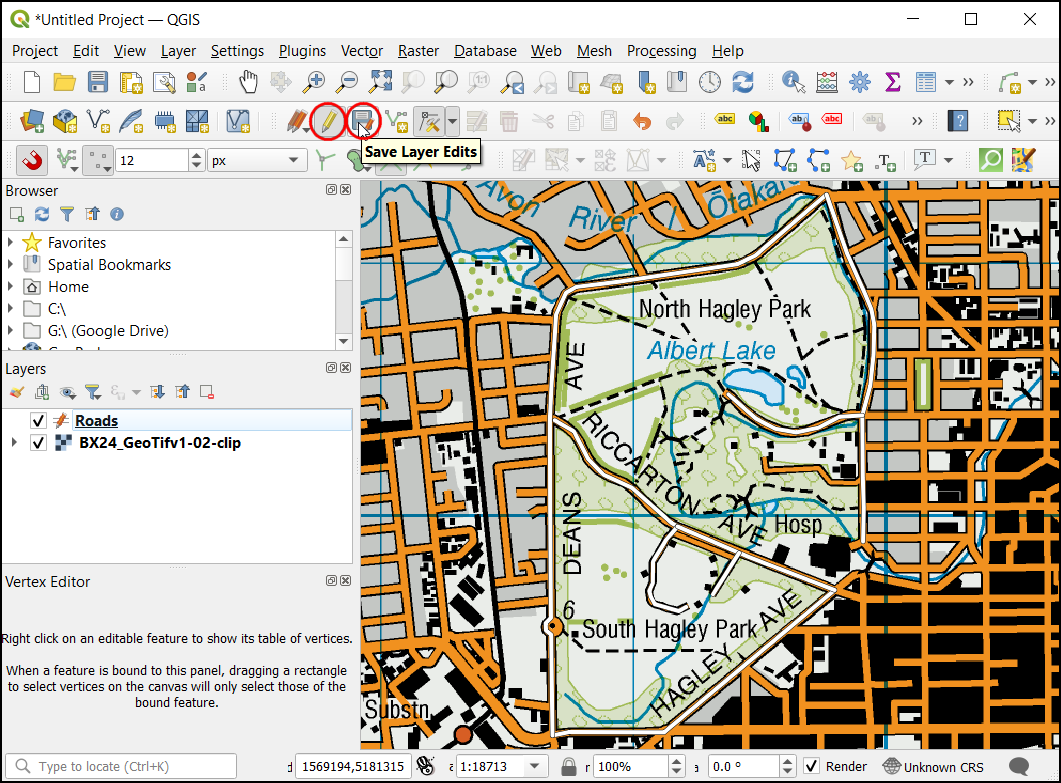
Now the road layer will be clearly visible. If you are satisfied with the work, click Save Layer Edits button to save the changes.
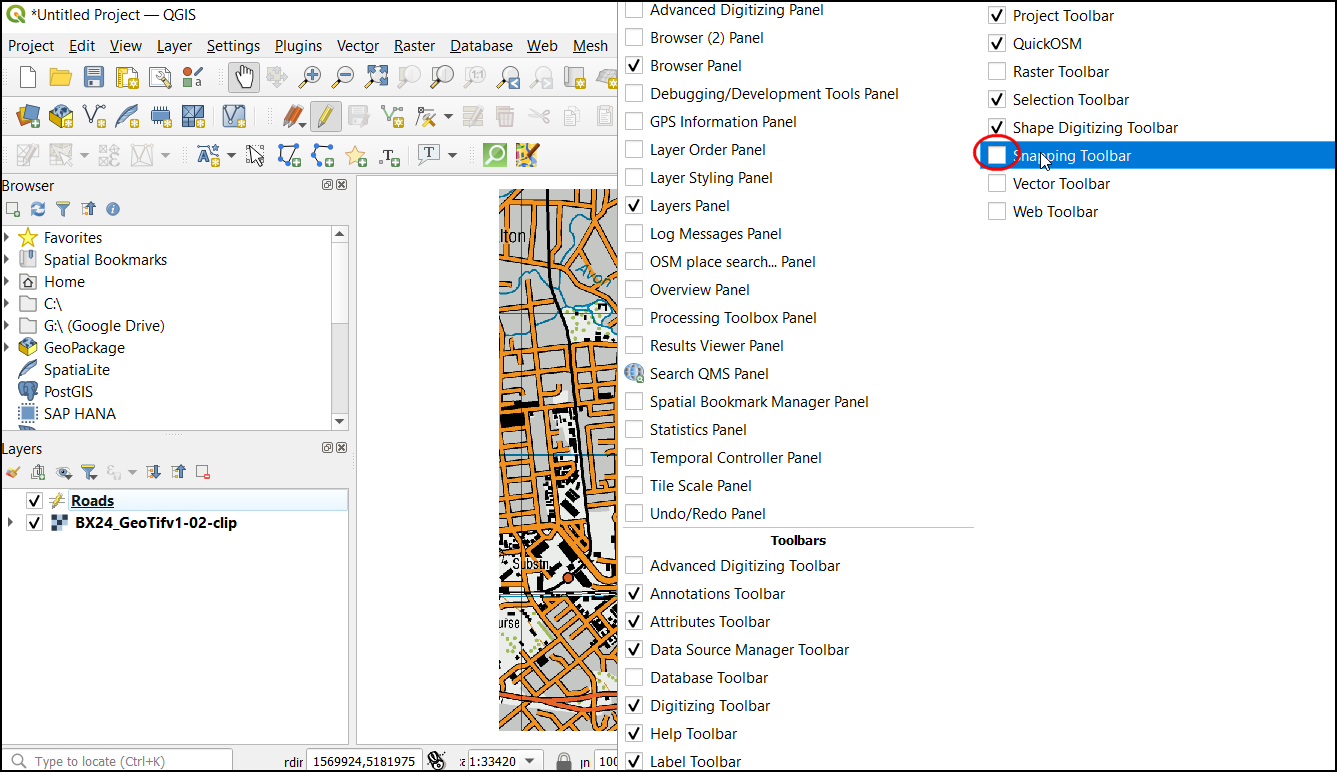
Before we digitize the remaining roads, it is essential to update some other important snap settings to create an error-free layer. Right-click on any space on the toolbar area and activate the Snapping toolbar.
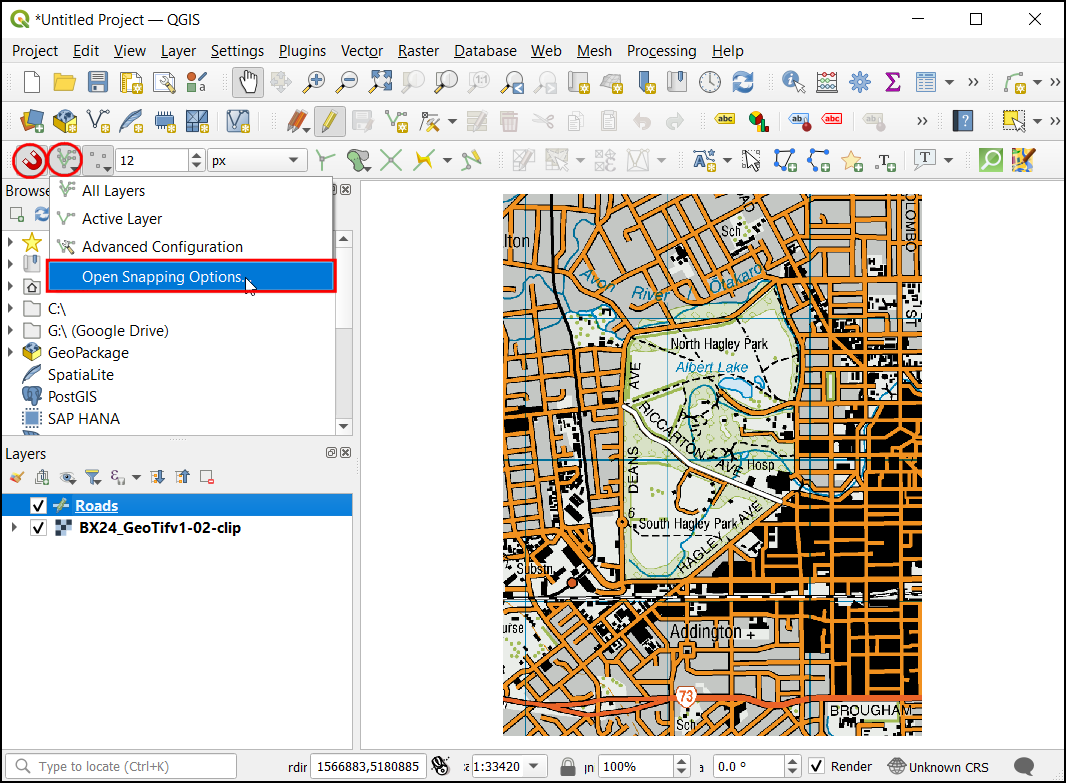
Now an Enable Snapping (Magnet Icon) will appear on the panel. Click on it to enable it and select All Layers and choose
Open Snapping Options...
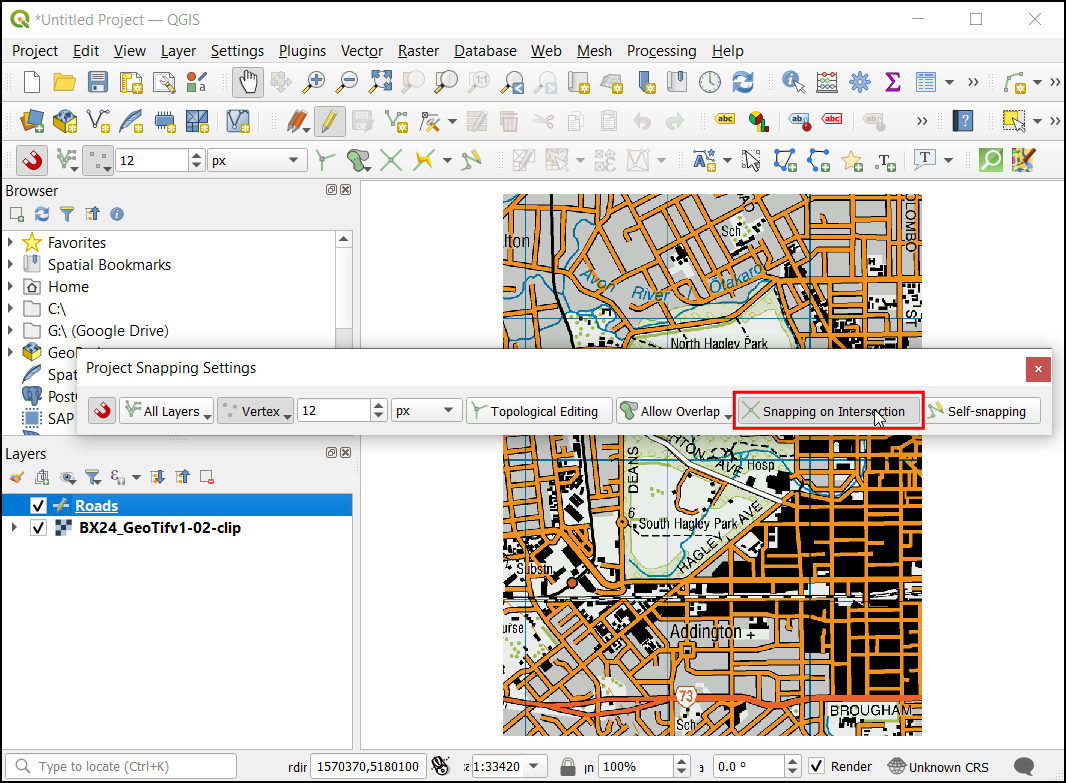
In the Snapping options dialog, click the Snapping on Intersection, which allows you to snap on an intersection of a background layer.
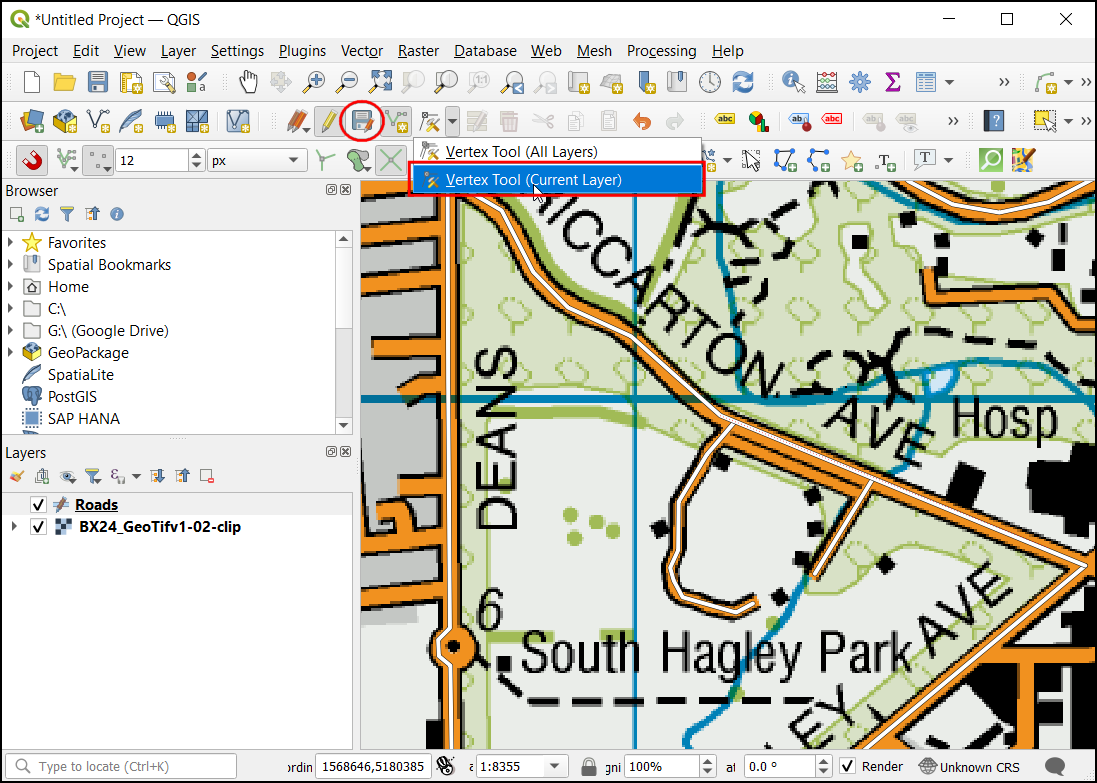
Now you can click Add feature button and digitize other roads around the park. Make sure to click Save Edits after adding a new feature to save your work. A helpful tool to help you digitize is the Vertex Tool. Click the Vertex Tool button and select
Vertex Tool (Current Layer).
Once the node tool is activated, click on any feature to show the vertices. Click on any vertex to select it. The vertex will change the color once it is selected. Now you can click and drag your mouse to move the vertex. This is useful when you want to make adjustments after the feature is created. You can also delete a selected vertex by clicking the Delete key. (Option+Delete on a mac)
Once you have finished digitizing all the roads, click the Toggle Editing button. Click Save.
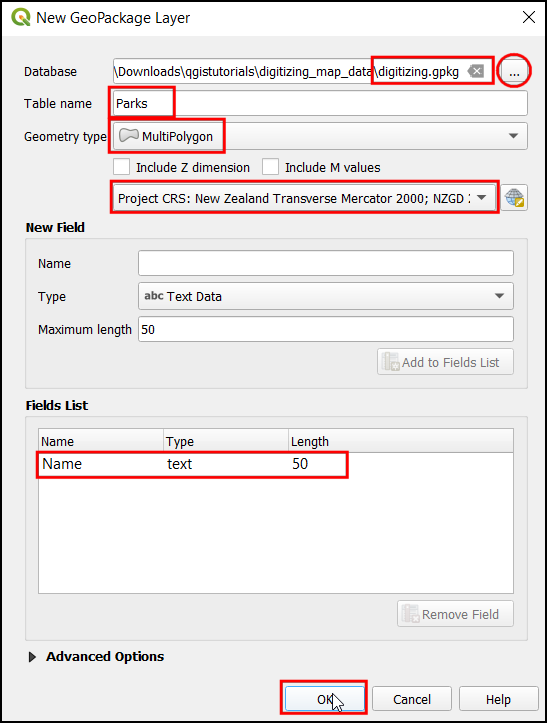
Now we will create another layer to digitize the parks as polygons. Click icon from Panels. In the New GeoPackage Layer dialog, click the … button and select the GeoPackage database named
digitizing.gpkg. Name the new layer as an attribute calledParks. SelectMultiPolygonas the Type. The base topographic map is theEPSG:2193 - NZGD 2000CRS. Click OK. In New Field EnterName, and the type as Text data, with50as Maximum length and click :guilabel:` Add to Fields List.`. Click OK.
참고
Polygon vs Multi-Polygon
Polygon - Planar Surface defined by 1 exterior boundary and 0 or more interior boundaries. Each interior boundary defines a hole in the Polygon.
Multi-Polygon - It is used to represent areas with holes inside or consisting of multiple disjoint areas. For eg, 3 discontinuous polygons can be drawn and grouped as a single feature.
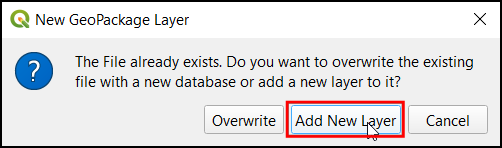
A pop-up dialog will appear. Select the Add New Layer button.
Now select layer
Parksthen clickroad Toggle Editing and click the Add feature button and click on the map canvas to add a polygon vertex. Digitize the polygon representing the park. Make sure you snap to the road’s vertices so there are no gaps between the park polygons and road lines. Right-click to finish the polygon.
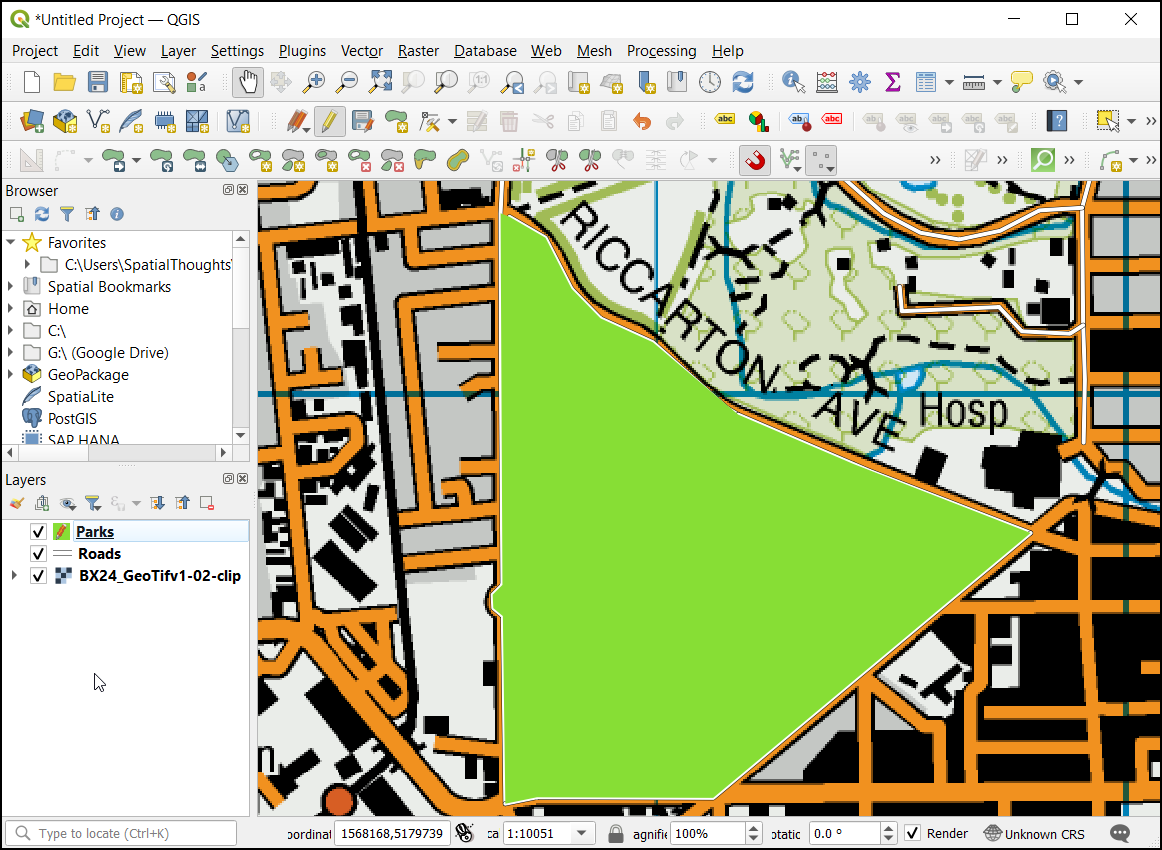
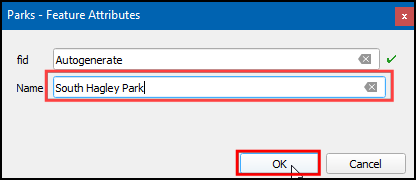
Enter the park name in the Parks - Feature Attributes pop-up.
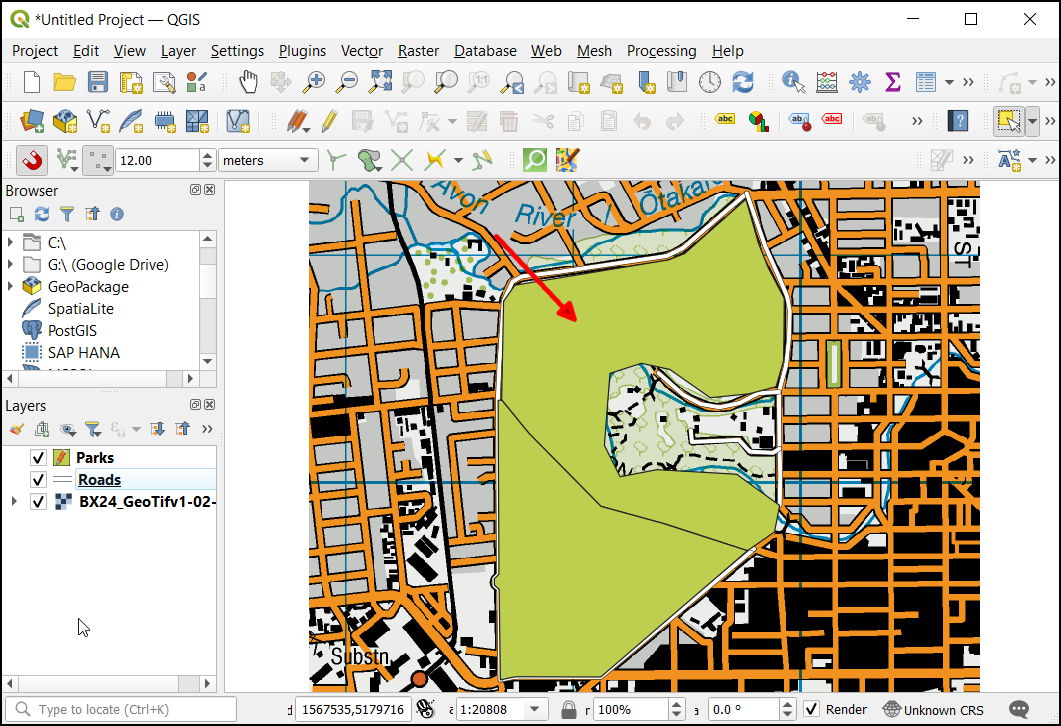
Now digitize the upper region of the park. Enter the park name and save the changes.
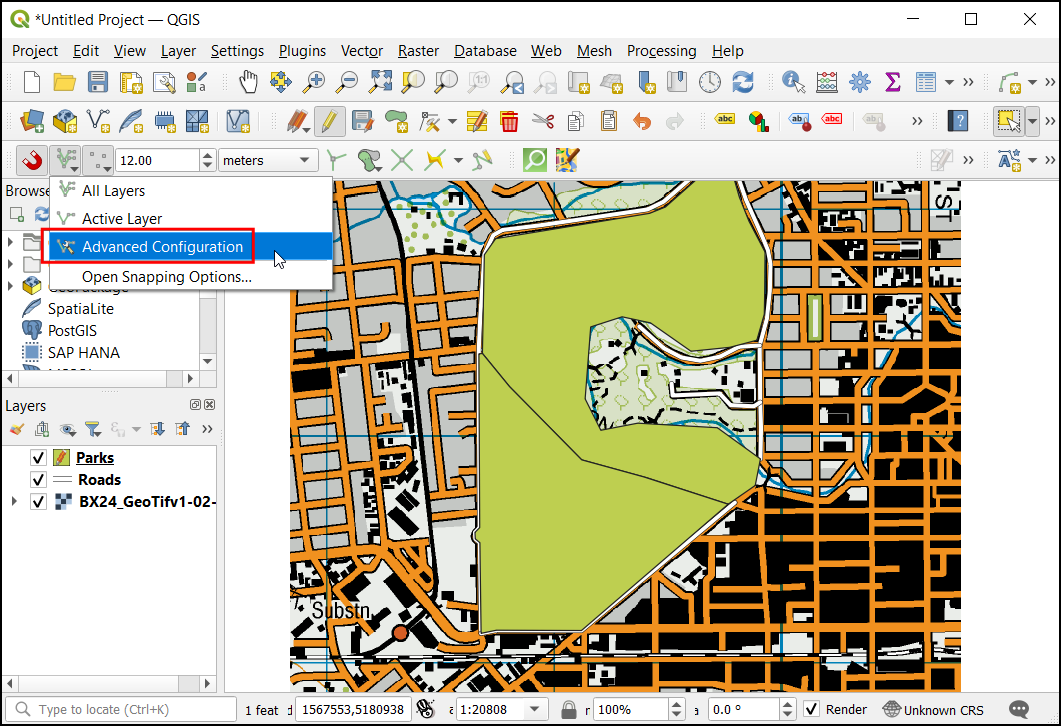
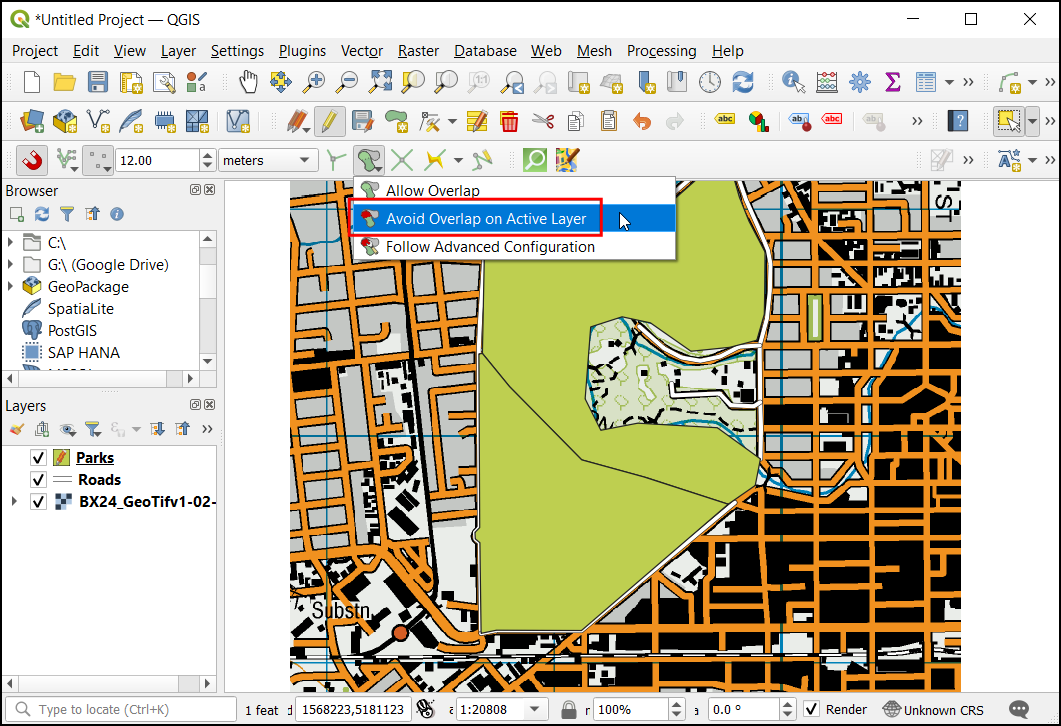
Now, before digitizing the inner polygon lets set settings that can ease this work. Multi-Polygon layers offer another useful setting called Avoid intersections of new polygons. Select Enable Snapping (Magnet Icon), click on it to enable it, and click All Layers and select
Advanced Configuration.
Click the
Avoid Overlap on Active layersbutton in the snapping toolbar.
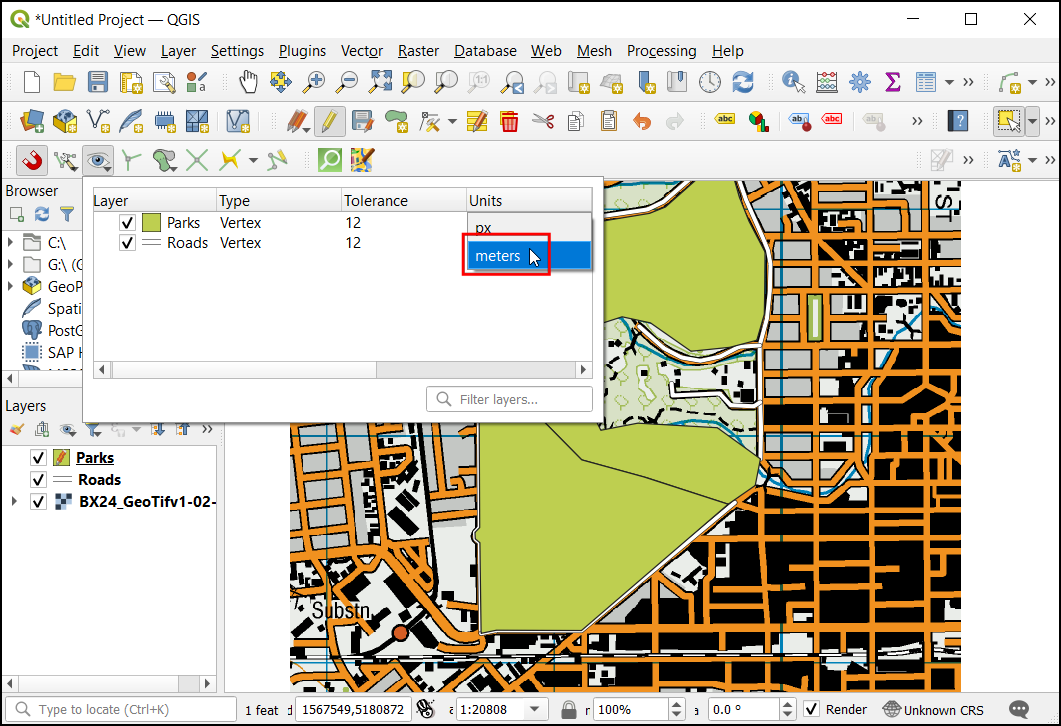
Now in Edit Advanced Configuration, select the Units as
pixels.
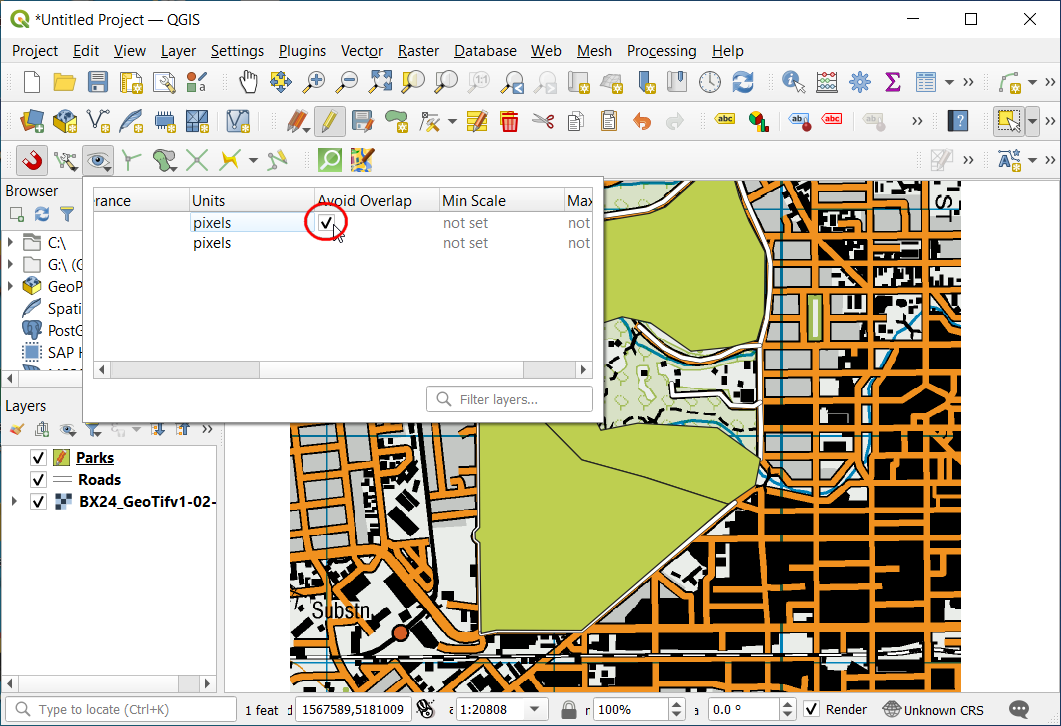
Check the box in the Avoid Overlap column in the row for the
Parkslayer.
Click on Add feature to add a polygon. With the Avoid Overlap, you will be able to quickly digitize a new polygon without worrying about snapping exactly to the neighboring polygons.
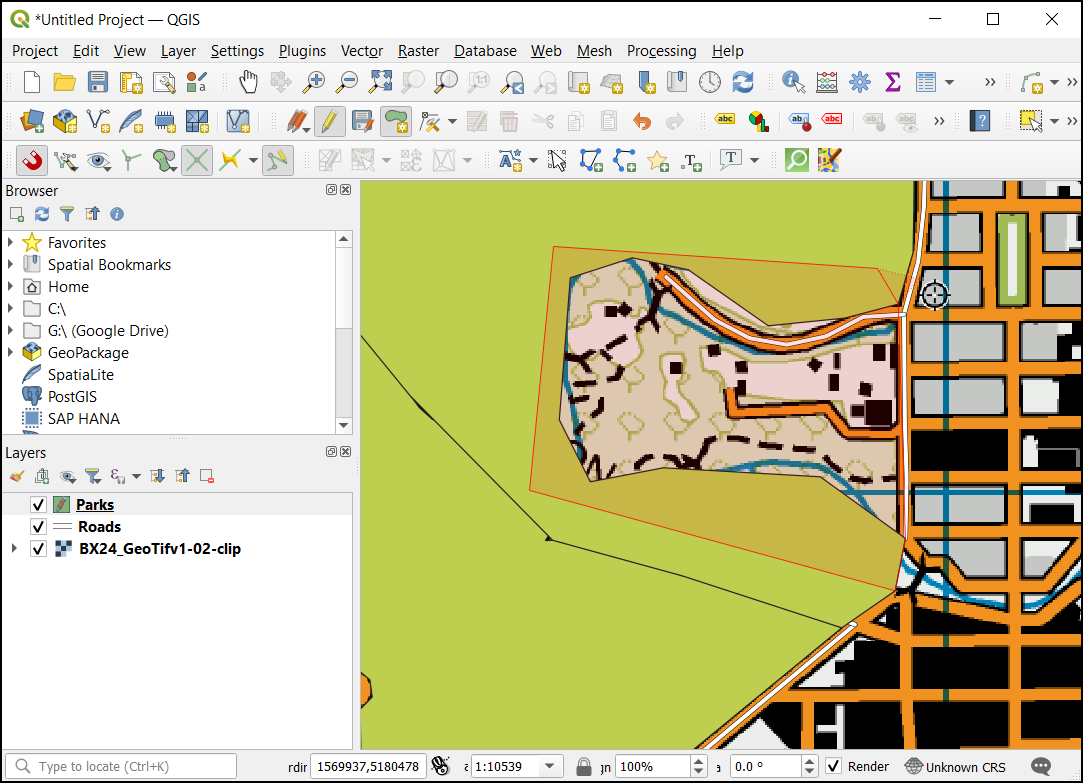
Right-click to finish the polygon and enter the attributes. Magically the new polygon is shrunk and snapped exactly to the boundary of the neighboring polygons! This is very useful when digitizing complex boundaries where you need not be precise and still have topologically correct polygon. Click Toggle Editing to finish editing the
Parkslayer.
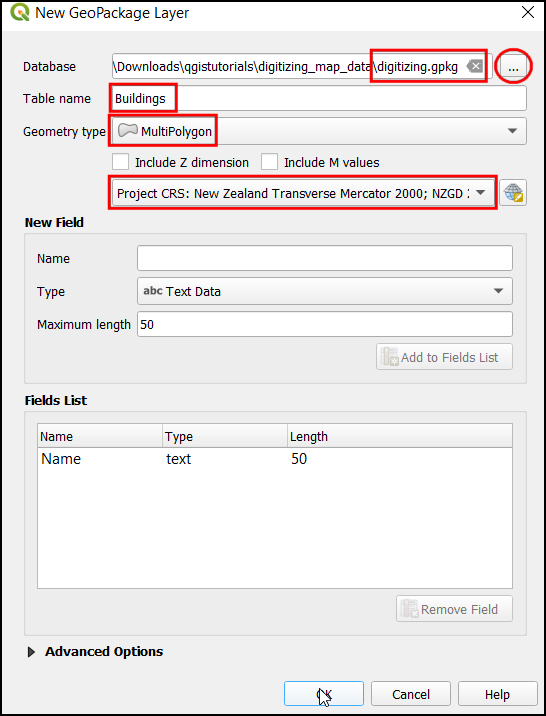
Now it is time to digitize a buildings layer. Create a new polygon layer named
Buildingsby clicking icon from Panels. Set the Buildings and MuiltiPolygon. Choose the CRS asEPSG:2193 - NZGD 2000. Click OK.
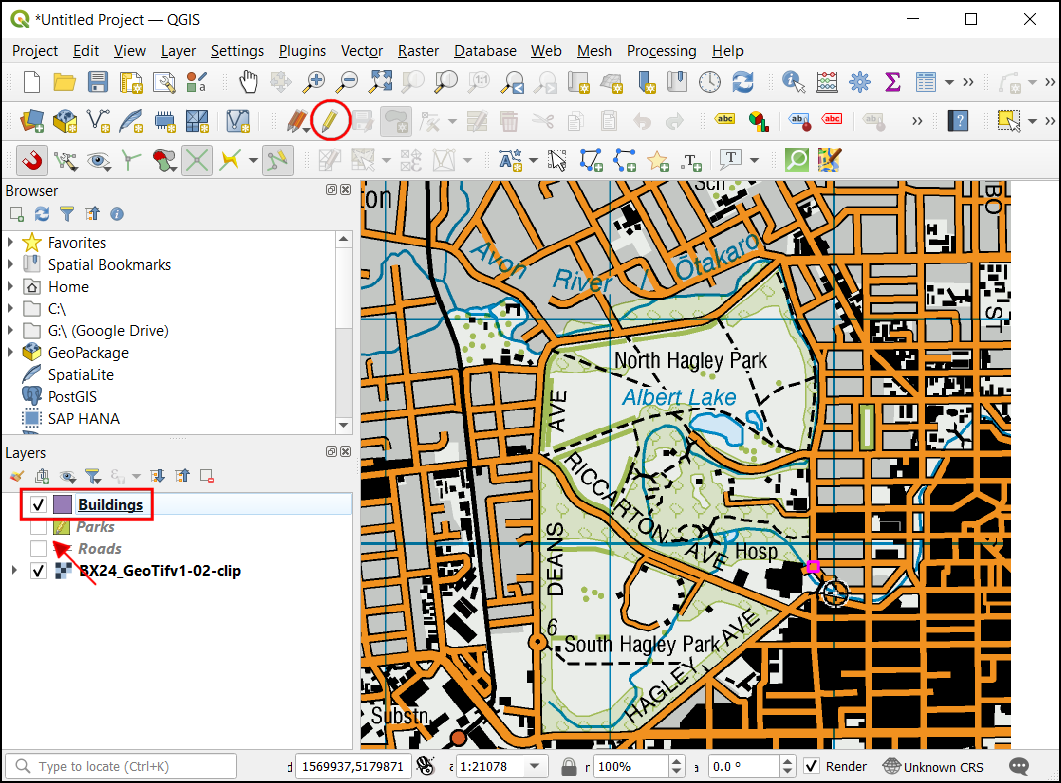
Once the
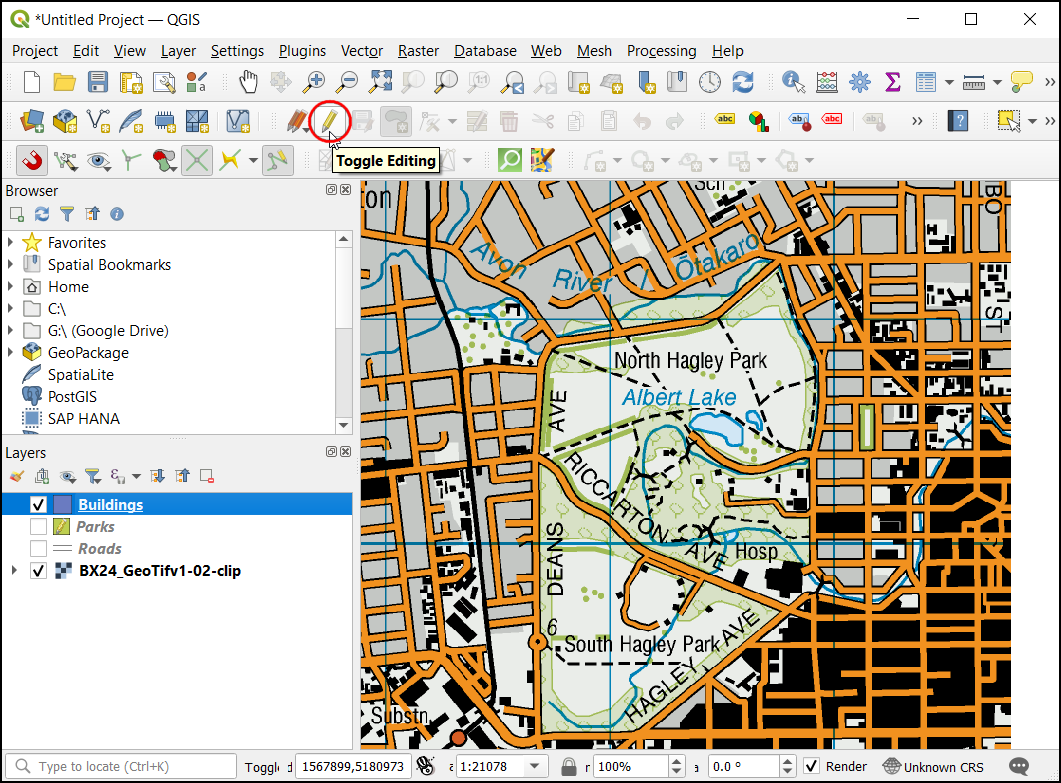
Buildingslayer is added, turn off theParksandRoadslayers to make the base topo map visible. Select theBuildingslayer and click Toggle Editing.
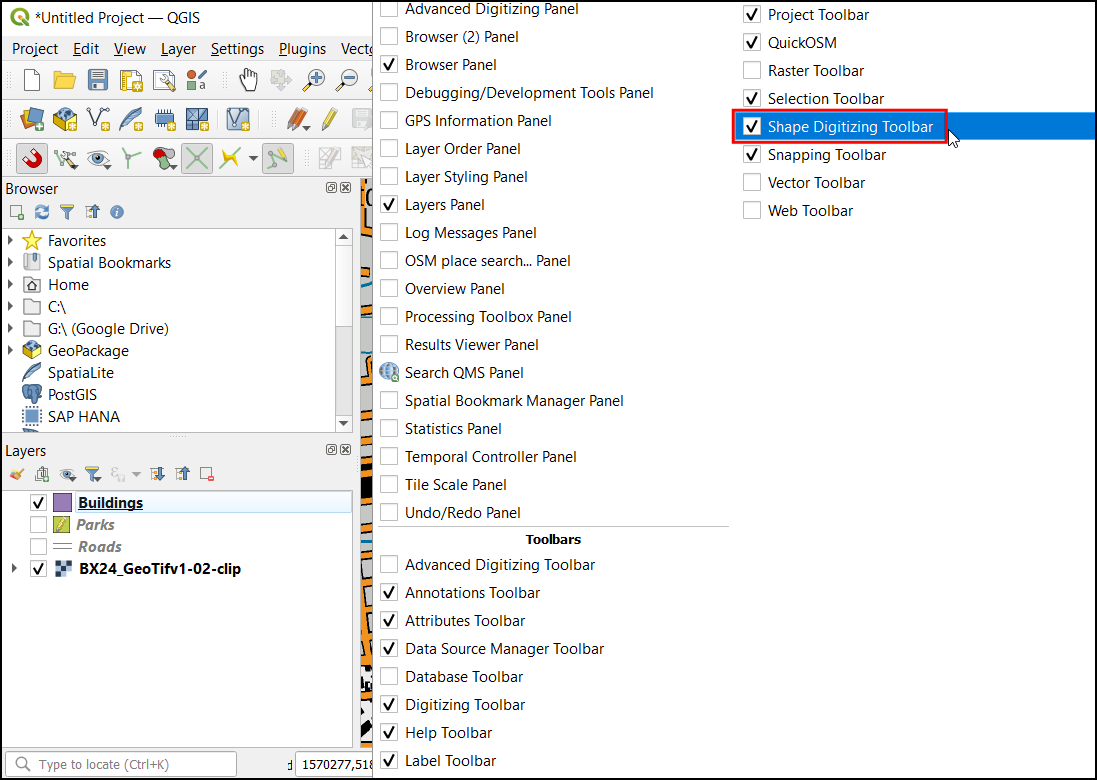
Digitizing buildings can be a cumbersome task, and also, it is challenging to add vertices manually so that the edges are perpendicular and form a rectangle. We will use a QGIS toolbar called Shape Digitizing to help with this task. Right-click on any empty space on the toolbar area and activate the
Shape Digitizing Toolbar.
Enable editing by pressing the pencil icon Toggle Editing.
Now under Add Rectangle dropdown select Add Rectangle from Extent button.
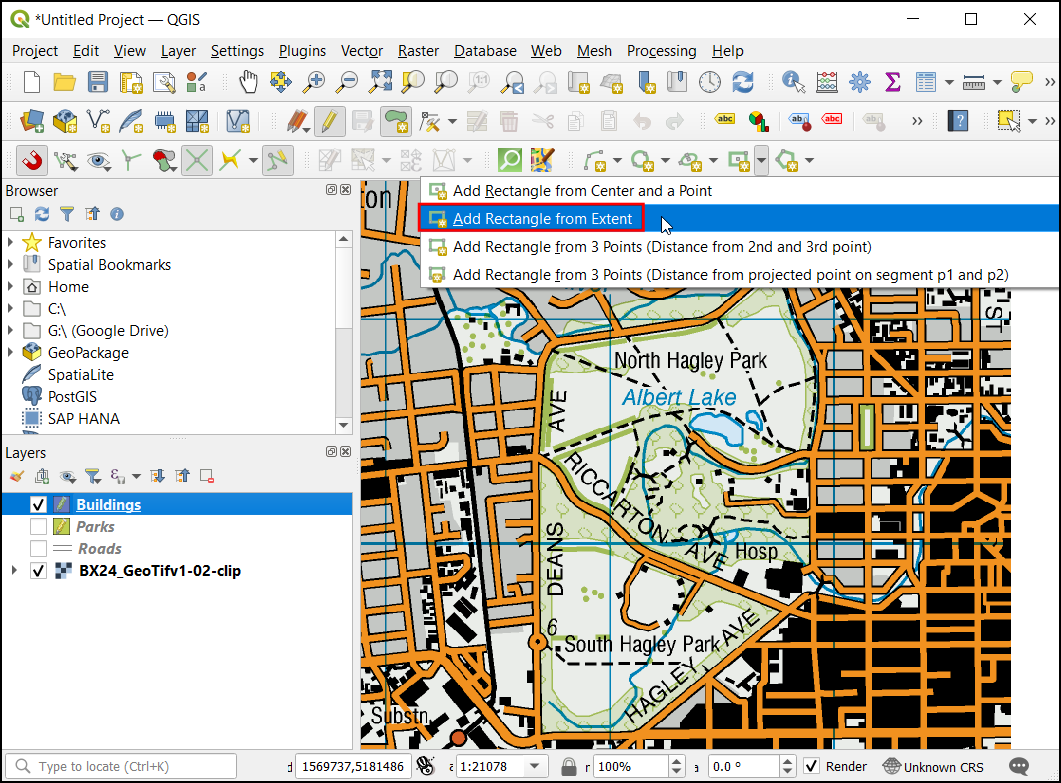
Zoom to an area with the buildings. Click and drag the mouse to draw a perfect rectangle. Similarly, add the remaining buildings.
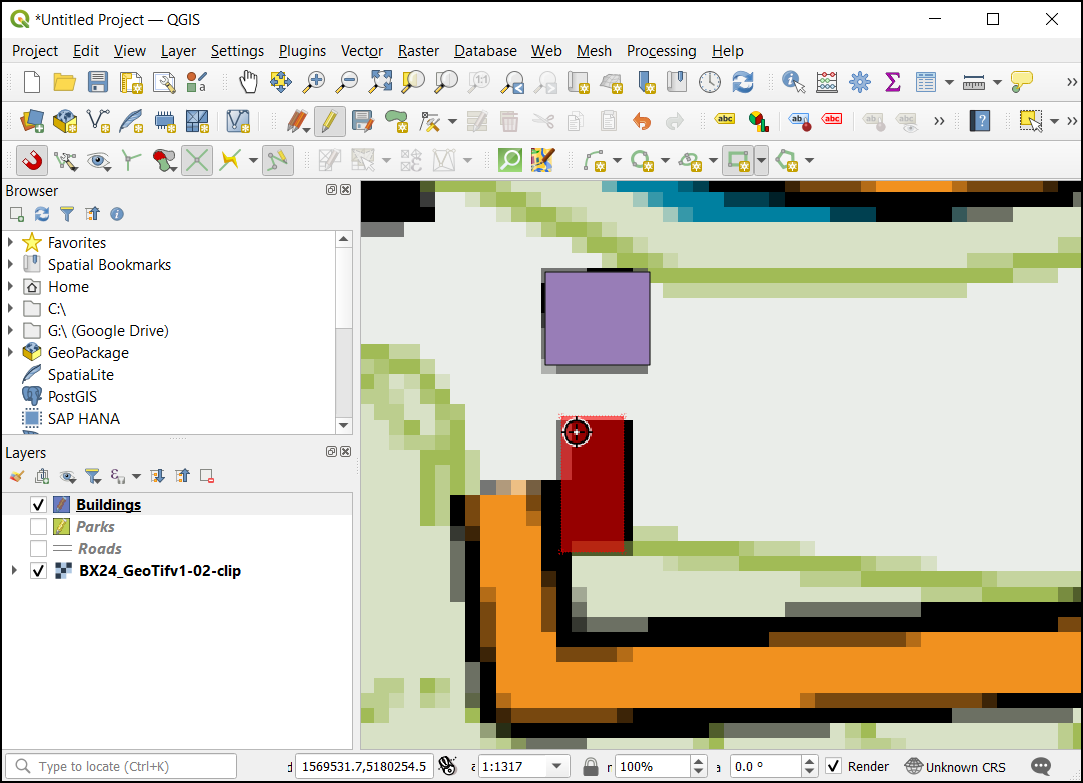
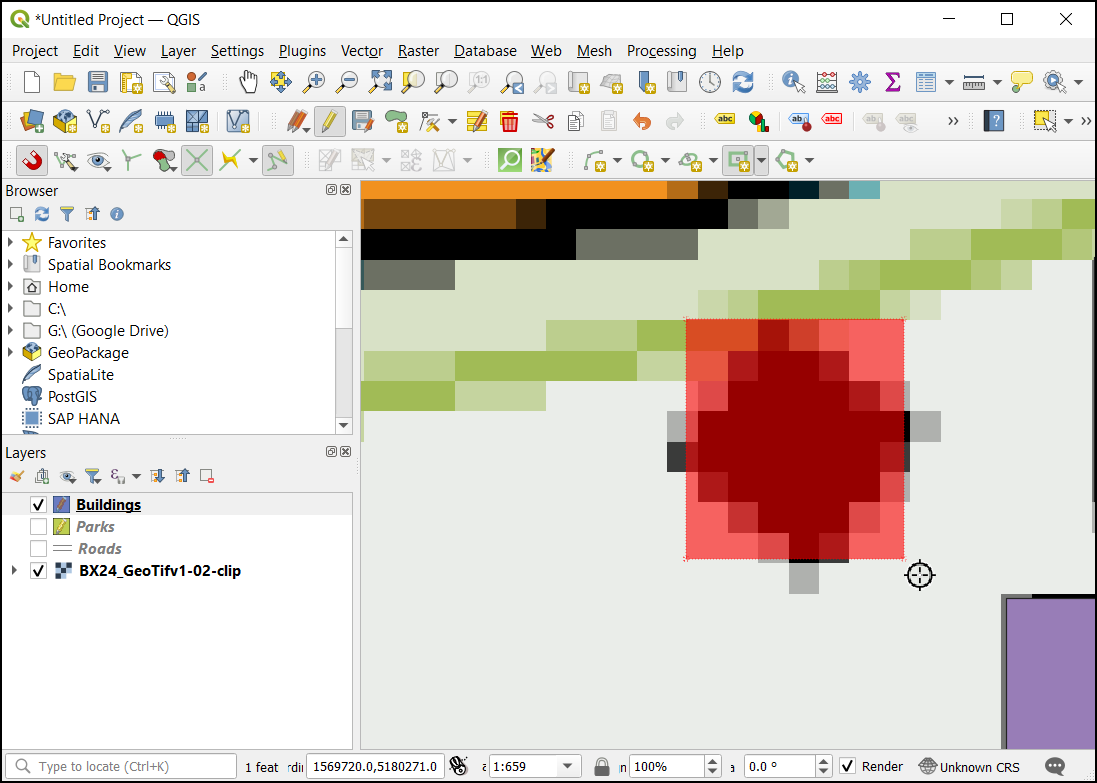
You will notice that some buildings are not vertical, and we will need to draw a rectangle at an angle to match the building footprint. Under Add Rectangle dropdown select Add Rectangle from Center and a Point button.
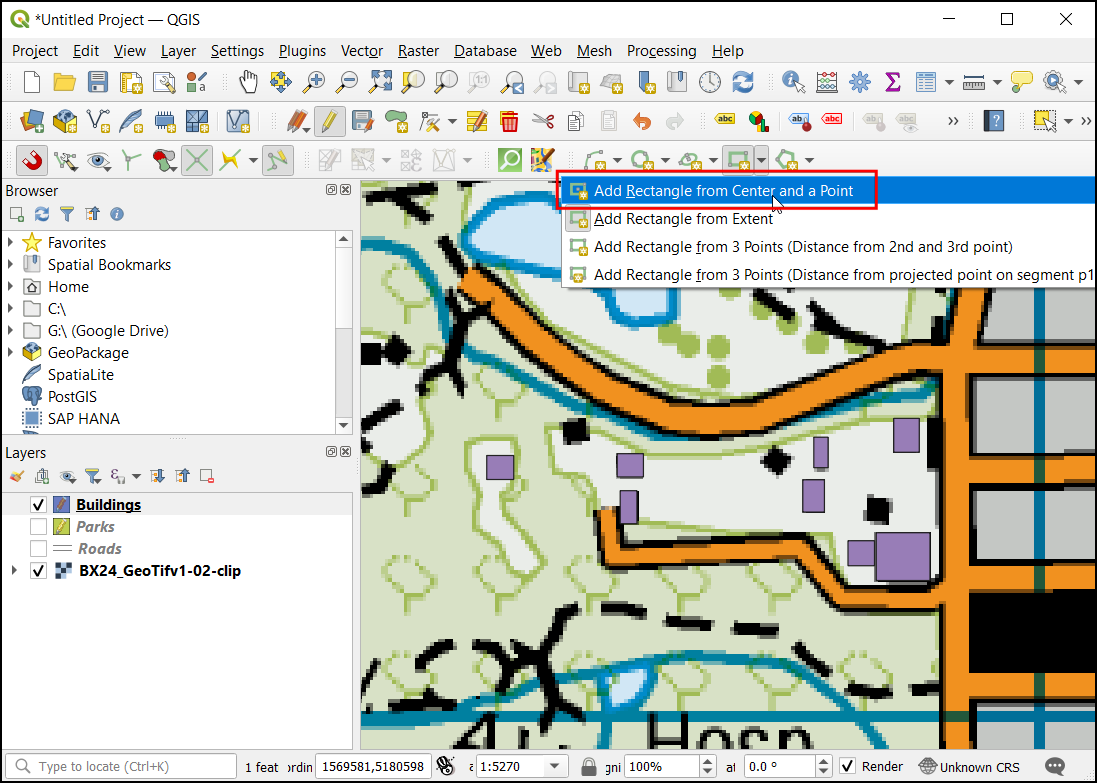
Zoom to an area of diamond-shaped buildings. Click on the center to drop a point and drag the mouse to draw a rectangle.
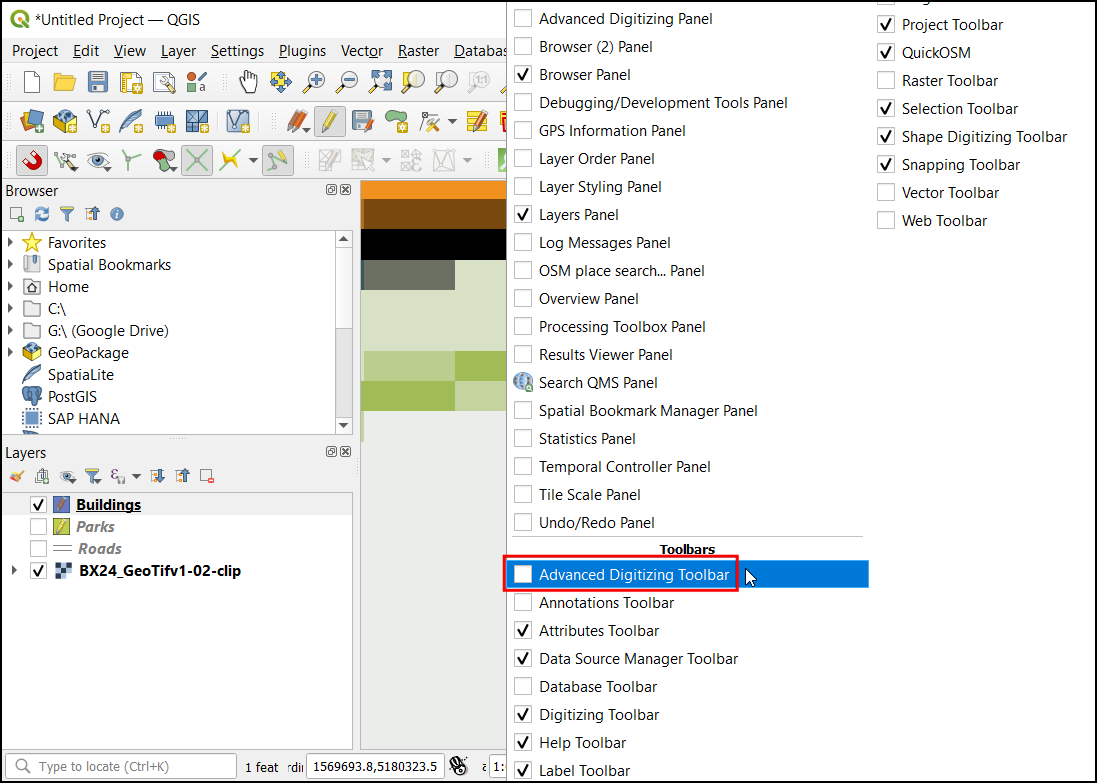
We need to rotate this rectangle to match the image on the topo map. The rotate tool is available in the Advanced Digitizing toolbar. Right-click on an empty area on the toolbar section and enable the Advanced Digitizing toolbar.
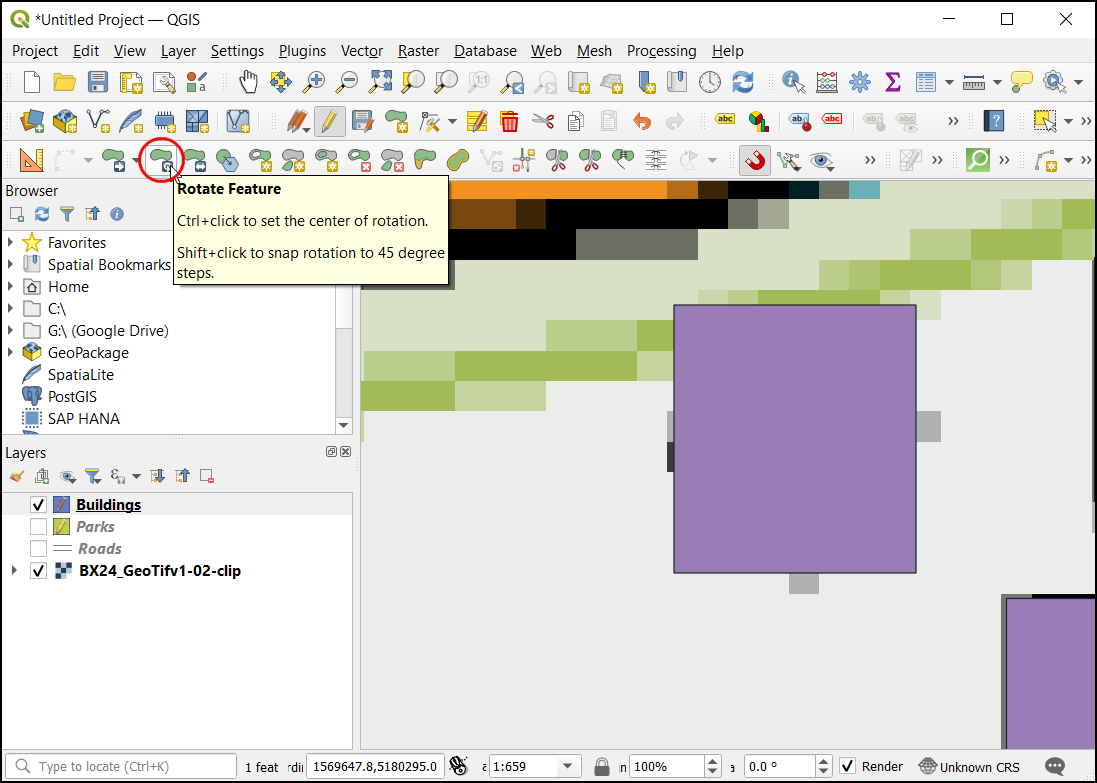
Click the Rotate Feature button.
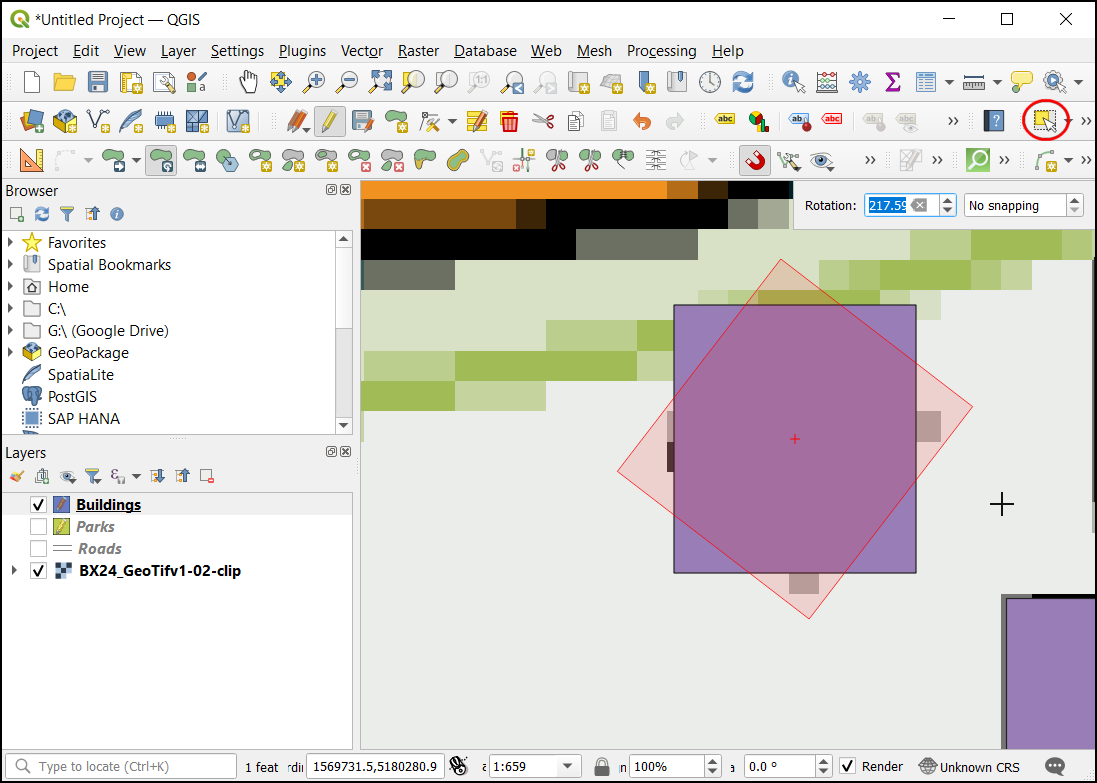
Use the Select Single feature tool to select the polygon you want to rotate. Once the Rotate Feature tool is activated, you will see crosshairs at the center of the polygon. Click exactly on that crosshairs and drag the mouse while holding the left-click button. A preview of the rotated feature will appear. Let go of the mouse button when the polygon aligns with the building footprint.
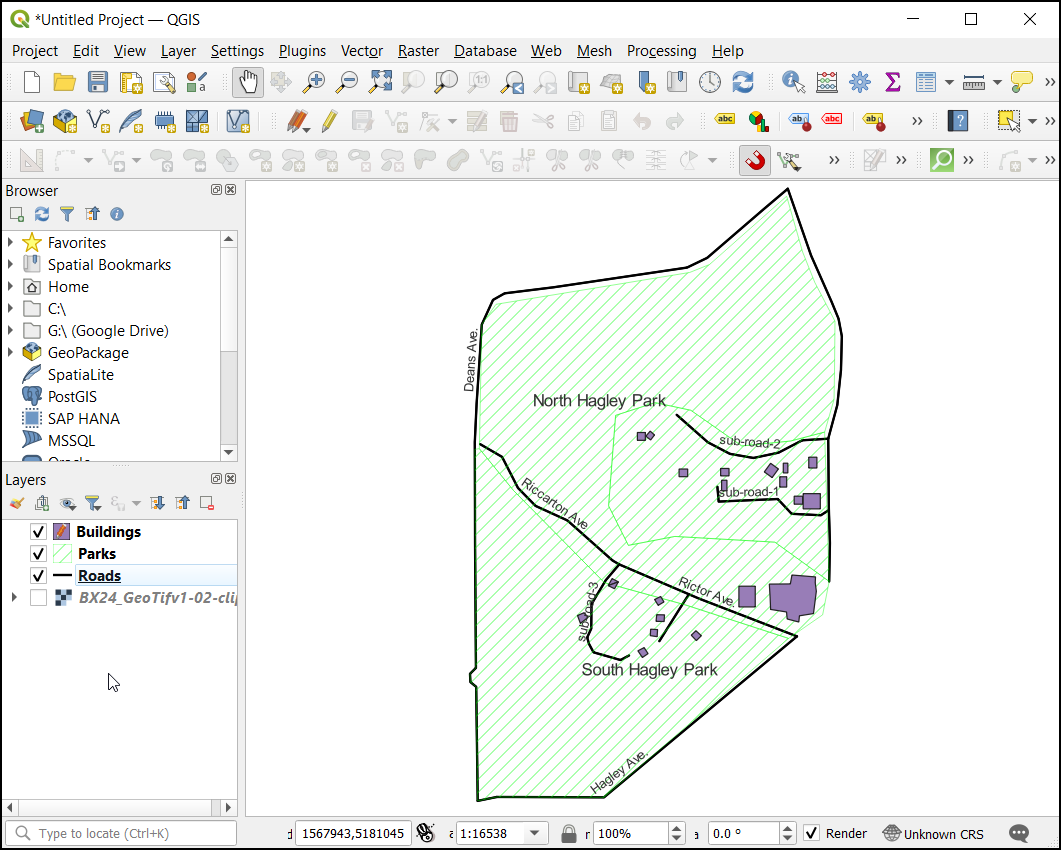
Save the layer edits and click Toggle Editing once you finish digitizing all buildings. You can drag the layers to change their order of appearance. The digitizing task is now complete. You can play with the styling and labeling options in layer properties to create a nice-looking map from the data you created.
If you want to give feedback or share your experience with this tutorial, please comment below. (requires GitHub account)